Figures & data
Figure 1. Schematic representation of the ABL kinase domains with the binding sites for competitive and allosteric inhibitors that are mentioned in the text. Tyr245 (Y) is the site of phosphorylation exposed in the open active conformation. The closed conformation of the apo enzyme is shaded with the cap clamping to the myristoyl pocket. The αl’ helix, which is composed of the DNA binding domain and the F-actin binding domain (D and F) closed after binding to the myristoyl pocket (A). Differences between the DFG in/out conformations (B). Approved ABL inhibitors (GNF-2/5, imatinib, axitinib, dasatinib) bind to different conformation states of the kinase. IS1 and IS8 are the thio-analogues of compound 6b, synthesised in our previous workCitation12. Approved ABL inhibitors and CP-31398 are used as reference compounds in this work (C).
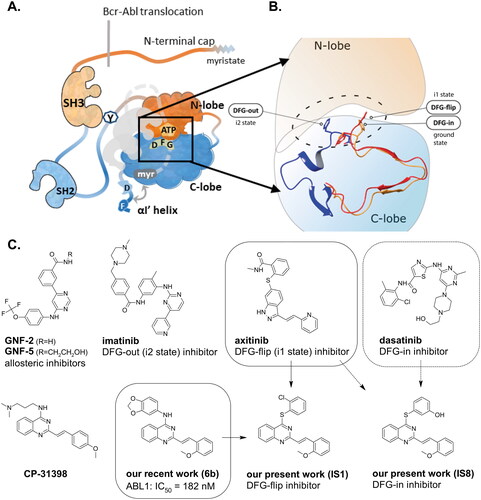
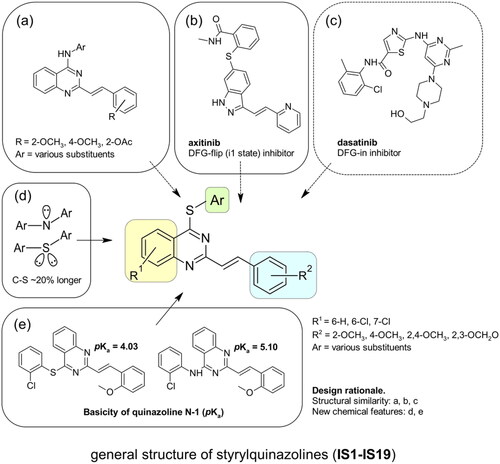
Figure 2. The rationalisation of the design of novel S4-substituted styrylquinazolines. An approach based on the similarity of structures (a-c) and chemical features (d-e).
Scheme 1. The general multi-stage chemical synthesis procedure of the target molecules. R1: 6-H, 6-Cl, 7-Cl; R2:2-OCH3, 4-OCH3, 2,4-OCH3, 2,3-OCH2O; Ar: various substituents (A). The synthetic procedure that was used to obtain arylthiols with a methylenedioxy moiety. (a) NBS, CH3CN; (b) X = H: Ac2O/H2SO4, EtOAc; (c) X = Br: HOSO2Cl, CH2Cl2 (B).
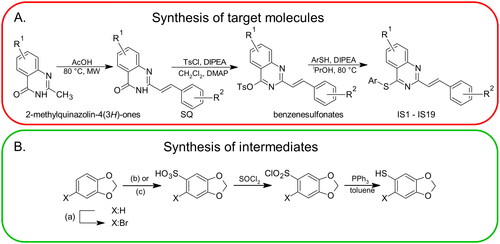
Table 1. Inhibitory activity of the styrylquinazoline compounds tested against a panel of non-receptor tyrosine kinases.
Figure 3. Inhibition of the ABL enzyme after treatment with IS1 styrylquinazoline alone and incombination with imatinib (A), dasatinib (B) and GNF-2 (C). The data were analysed using a two-way ANOVA with Tukey’s post-hoc test: *p < 0.05, **p < 0.01, ***p < 0.001, ****p < 0.0001.
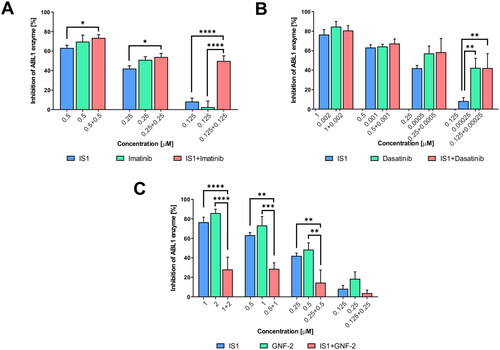
Table 2. Docking results of the compounds tested with ABL kinase in different conformational states.
Figure 4. Docking results of the IS1 and I8 derivatives with ABL DFG-out (PDB: 2HYY), ABL DFG-flip (PDB: 4WA9) and ABL DFG-in (PDB: 2GQG). The first lines represent the 2D diagrams of the interactions, whereas the second lines represent the 3D models with the imatinib (DFG-out), axitinib (DFG-flip) or dasatinib (DFG-in) overlay (indicated as a green structure). The 2D and 3D models were generated using Schrodinger Maestro 12 software.
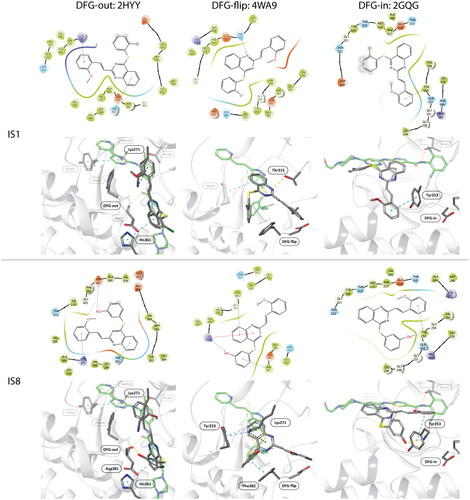
Table 3. Interactions between the compounds tested and ABL kinase in the DFG-out, -flip or -in state. YES indicates a distance of less than 3 Å.
Table 4. Antiproliferative activity of the studied derivatives against a panel of cancer cells and normal fibroblast (NHDF) cell line.
Figure 5. Effect of IS1, IS8, IS10, imatinib, axitinib and GNF-2 on the progression of the cell cycle in K562 cells. The flow cytometry histograms show the distribution of cells in the G0/G1, S and G2/M phases of the cell cycle for one of the experiments (A). The data were analysed using a one-way ANOVA with Dunnett’s post-hoc test: *p < 0.05, **p < 0.01, ***p < 0.001, ****p < 0.0001 compared with the control (B).
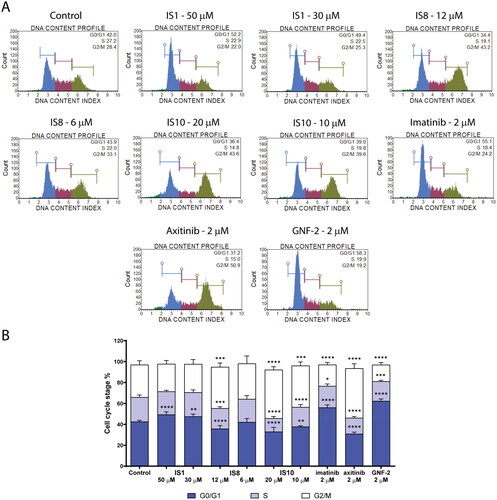
Figure 6. Evaluation of apoptosis induction in K562 cells after a 30-h treatment with IS1, IS8, IS10 and axitinib. The flow cytometry histograms indicate the percentage of early and late apoptosis for one of the experiments (A). The data were analysed using a one-way ANOVA with Dunnett’s post-hoc test: *p < 0.05, **p < 0.01, ***p < 0.001, ****p < 0.0001 compared to the control. The table includes the mean ± SD percentage of the live, early and late apoptotic cells from all of the conducted experiments (B).
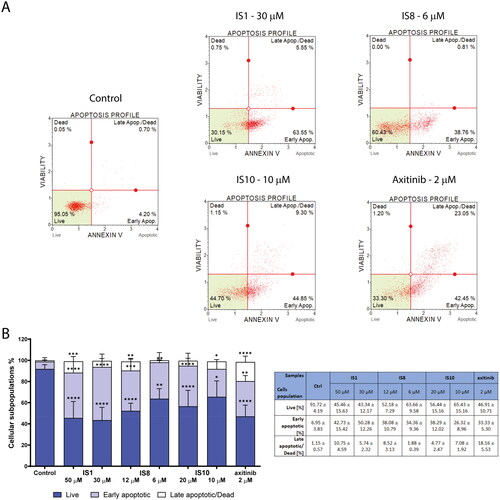
Figure 7. Effect of the derivatives tested for activation of the ABL pathway and its downstream targets (A, B). The densitometric analysis plots show the obtained results normalised to the reference protein (vinculin, GAPDH or β-actin). Results are shown as the mean value ± SD from three independent experiments (C). The data were analysed using a one-way ANOVA with Dunnett’s post-hoc test: *p < 0.05, **p < 0.01, ***p < 0.001, ****p < 0.0001 compared to the control.
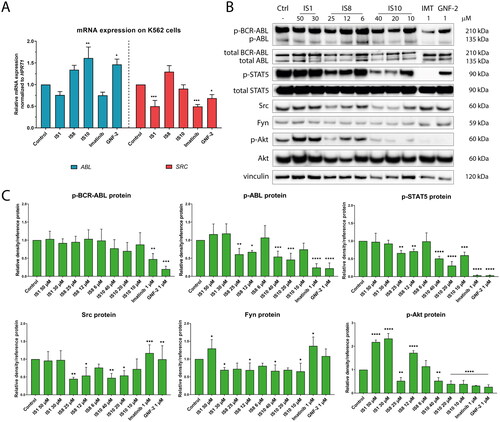
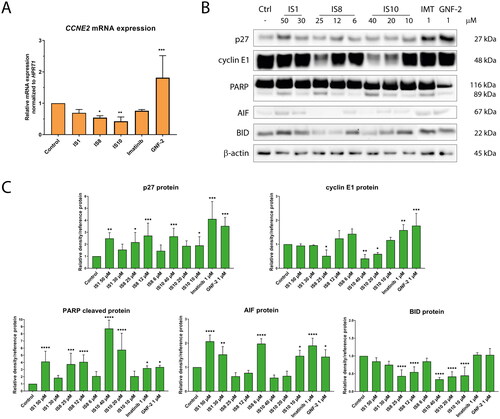
Figure 8. The impact of the tested styrylquinazoline on the expression of the genes (A) and proteins (B) involved in cell cycle progression and apoptosis induction. Densitometric analysis results have been normalised to reference proteins (vinculin, GAPDH or β-actin). Results are shown as mean ± SD from three independent experiments (C). Data were analysed using a one-way ANOVA with Dunnett’s post-hoc test: *p < 0.05, **p < 0.01, ***p < 0.001, ****p < 0.0001 compared to the control.