
Figures & data
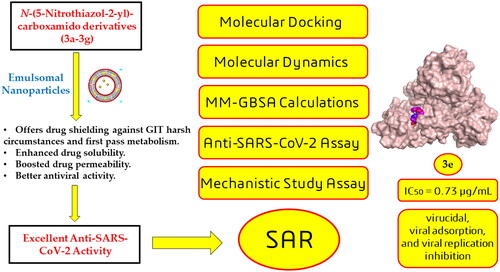
Figure 1. Examples of reported potential Mpro inhibitors and how they function against SARS-CoV-2.

Scheme 1. Chemical synthesis of the previously designed 3a–g candidates to combat COVID-19Citation31.

Figure 2. Rationale design for the synthesised N-(5-nitrothiazol-2-yl)-carboxamido derivatives as potential inhibitors of SARS-CoV-2 Mpro and the promising effect of the emulsomal nanoparticles.

Table 1. 23 full factorial experimental designs; experimental runs, independent variables, and estimated responses of three loaded EMLs.
Table 2. 23 Output factorial analysis data of 3b-loaded EMLs and the predicted, observed responses, and deviation percent of the Optimum formula (F6).
Figure 3. 3D surface plot of the impact of (A) lipid core amount, (B) PC amount, and (C) Brij 52 amount on EE% of 3b-loaded EMLs.

Figure 4. 3D surface plot of the impact of (A) lipid core amount, (B) PC amount, and (C) Brij 52 amount on PS of 3b-loaded EMLs.

Figure 5. 3D surface plot of the impact of (A) lipid core amount, (B) PC amount, and (C) Brij 52 amount on ZP of 3b-loaded EMLs.

Figure 6. DSC thermograms of pure compound 3b, blank F6, and 3b-loaded F6.

Figure 7. In vitro drug release profile of 3b from optimised formula F6 compared to the drug dispersion.

Figure 8. In vitro assessment of cytotoxicity and anti-SARS-CoV-2 activity of F3a–g in Vero E6 cells via MTT assay (hCoV-19/Egypt/NRC-03/2020 (accession number on GSAID: EPI_ISL_430820)).

Figure 9. Mode of action of the most potent formulation (F3e) against SARS-CoV-2.

Table 3. 3D interactions and positioning of the Co inhibitor of SARS-CoV-2 Mpro (PDB ID: 6Y2G) binding pocket and the most active candidates (3d, 3e, and 3g).
Figure 10. The RMSD of complexes (3a, 3b, 3c, 3d, 3e, 3f, 3g, and Co) for SARS-CoV-2 Mpro as a function of simulation time (200 ns).

Figure 11. The RMSD of ligands (3a, 3b, 3c, 3d, 3e, 3f, 3g, and Co) for SARS-CoV-2 Mpro, respectively, as a function of simulation time (200 ns).

Figure 12. Histogram describing the binding interactions between the SARS-CoV-2 Mpro and its ligand during the simulation time of 200 ns for (A) 3d, (B) 3e, (C) 3g, and (D) Co.

Figure 13. Heat map showing the total number of SARS-CoV-2 Mpro-ligand interactions all over the simulation time of 200 ns for (A) 3d, (B) 3e, (C) 3g, and (D) Co.

Table 4. Prime MM-GBSA energies for complexes (3a, 3b, 3c, 3d, 3e, 3f, 3g, and Co) of SARS-CoV-2 Mpro protein.
Figure 14. SAR summary for the synthesised N-(5-nitrothiazol-2-yl)-carboxamido derivatives as potential inhibitors of SARS-CoV-2 Mpro.
