
Figures & data
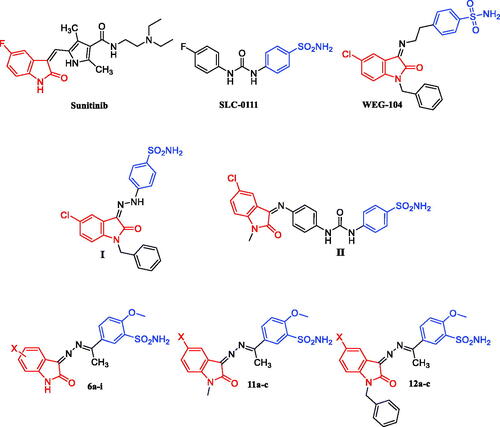
Figure 1. Structure of Sunitinib, SLC-0111, WEG-104, compounds I-II, and target compounds 6a-i, 11a-c and 12a-c.
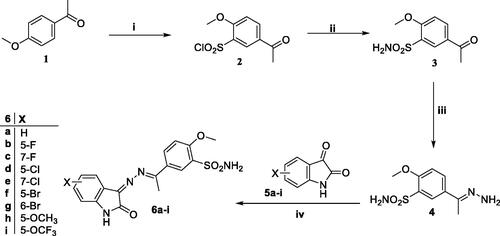
Scheme 1. General procedure for the synthesis of target compounds 6a-i. Reagents and conditions: i) HOSO2Cl, SOCl2 at 0 °C and then rt, 26 h ii) EtOH, ammonia, rt iii) NH2NH2.H2O, AcOH (cat.), and EtOH, reflux, 4 h. iv) EtOH, AcOH (cat.), reflux, 6–8 h.
Scheme 2. General procedure for the synthesis of target compounds 11a-c and 12a-c. Reagents and conditions: i) K2CO3, acetonitrile, reflux, 5 h; ii) EtOH, AcOH, reflux, 4 h.
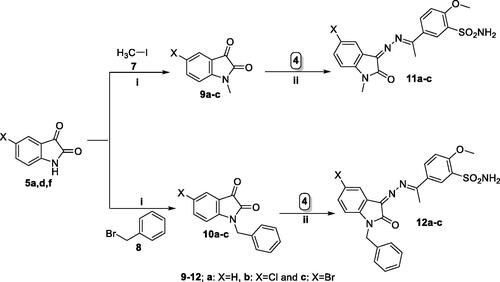
Figure 2. % GI for the highly affected cell lines on treatment by the target isatin derivatives using single dose of 10 μM.
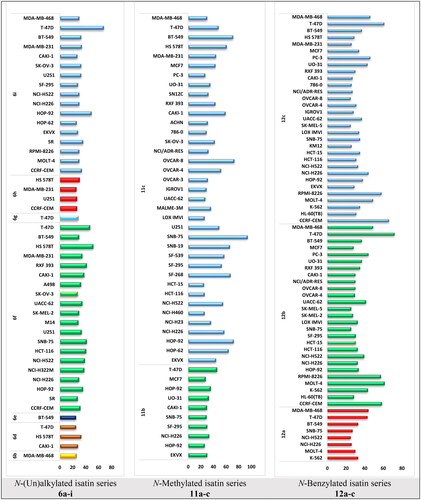
Table 1. Cytotoxicity of selected compounds 6f, 6i, 11b-c, and 12a-c (IC50) against T47D cells.
Table 2. IC50 values of selected compounds 6f, 11b-c, and 12b against VEGFR-2 and CA inhibition activity.
Figure 3. Phases distribution of T47D cells upon incubation with 11b and 12b.
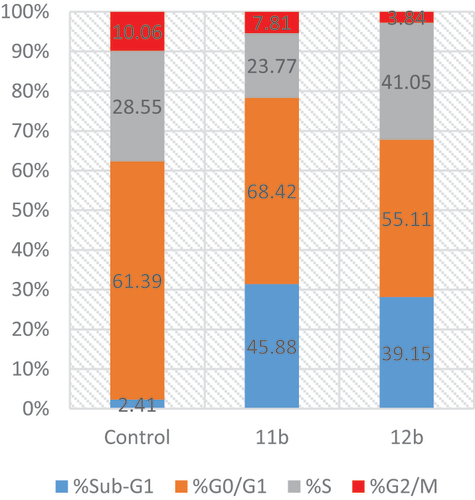
Figure 4. Apoptosis rate quantification (%) and necrosis in (A) flow cytometry, effect of (B) control, (C) 11b and (D) 12b on annexin V-FITC-positive staining (%) in T47D cell line.
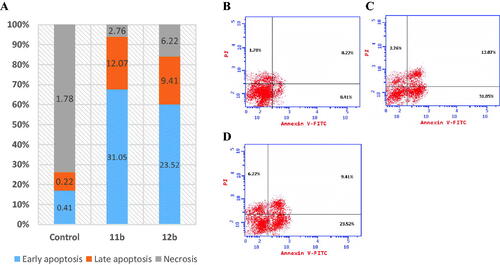
Figure 5. Docking of 12b inside the active site of VEGFR-2 receptor (code: 4ASD); active site view (top) and 2D schematic view of the interactions (bottom).
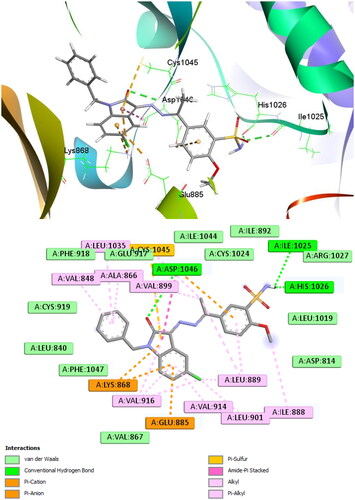
Figure 6. From left to right: (A) Temperature, (B) pressure and (C) potential energy during the 100 ns MD simulations.
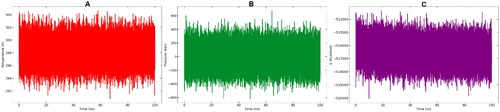
Figure 7. RMSD, Radius of gyration and average centre of mass distance of heavy atoms of 12b during 100 ns MD simulation.
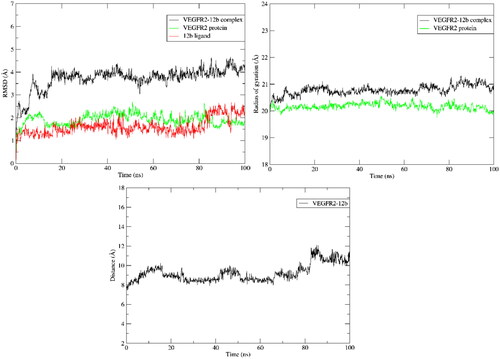
Figure 8. RMSF and SASA of VEGFR-2 in presence and absence of 12b over 100 ns MD simulation.
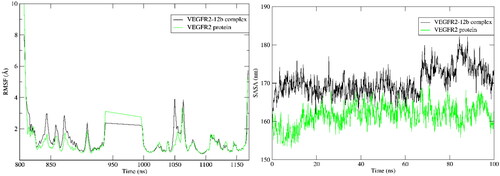
Figure 9. Different types of interaction exhibited by 12b with the amino acids within the active site of VEGFR-2 during the whole MD simulation frames.
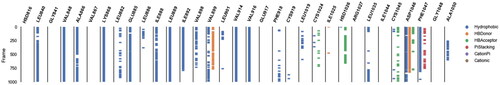
Figure 10. Hydrogen bonds between VEGFR-2 and 12b during 100 ns MD simulation.
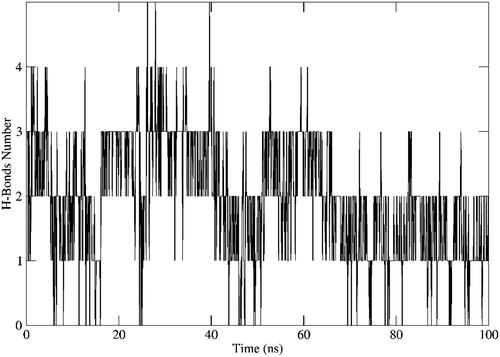
Table 3. Free binding energies of 12b with VEGFR-2 in kJ/mol.