Figures & data
Figure 1. Chemical structures of curcumin analogues and reaction of 3β-hydroxysteroid dehydrogenase (3β-HSD): Structures of curcumin analogues (A); (B) Gonadal 3β-HSD catalyses pregnenolone (P5) to progesterone (P4).
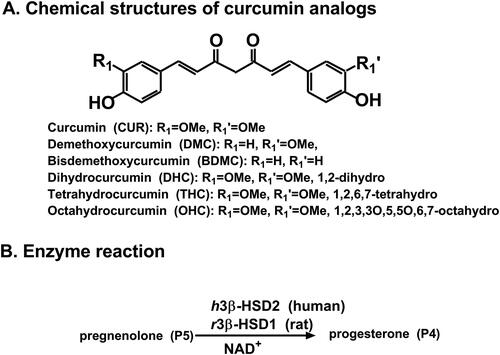
Figure 2. Michaelis-Menten kinetics, residual activity and dose response of curcumin analogues on human 3β-HSD2: Michaelis-Menton kinetics (A); Residual activity relative to the control (DMSO) at 100 µM curcumin analogues (B): Compared with the control, ** p < 0.01, *** p < 0.001 (n = 4, mean ± SEM); IC50 value of curcumin (CUR), demethoxycurcumin (DMC) and bisdemethoxycurcumin (BDMC), and tetrahydrocurcumin (THC) (C-F: n = 4, mean ± SEM).
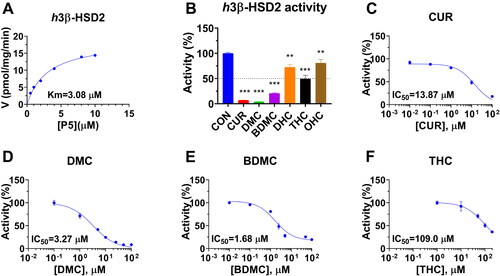
Figure 3. Enzyme kinetics-inhibition and Lineweaver-Burk plot analysis of curcumin analogues on human 3β-HSD2: Enzyme kinetics-inhibition analysis for curcumin (CUR), demethoxycurcumin (DMC) and bisdemethoxycurcumin (BDMC) (A-C); Lineweaver-Burk plot analysis for CUR, DMC, and BDMC (D-F), n = 4.
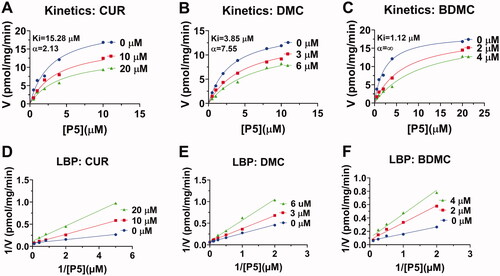
Table 1. Half maximal inhibitory concentration (IC50), inhibition constant (measured, Ki), inhibition Ki (calculated, Cal. Ki), lowest binding energy (LBE), mode action, and binding domain of curcuminoids.
Figure 4. Effect of curcumin analogues on progesterone output by human KGN cells under basal and cAMP (forskolin, FSK, 10 µM) conditions: Progesterone output under basal condition for curcumin (CUR), demethoxycurcumin (DMC) and bisdemethoxycurcumin (BDMC) (A, C, E); Progesterone output under FSK-stimulated condition for CUR, DMC, and BDMC (B, D, F): Compared with the control, *p < 0.05, **p < 0.01, ***p < 0.001 (n = 4, mean ± SEM) for each concentration.
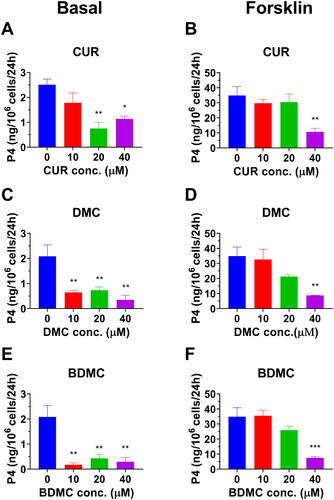
Figure 5. Michaelis-Menten kinetics, residual activity and dose response of curcumin analogues on rat 3β-HSD1: Michaelis-Menton kinetics (A); Residual activity relative to the control (DMSO) at 100 µM curcumin analogues (B): Compared with the control, **p < 0.01, ***p < 0.001 (n = 4, mean ± SEM); IC50 value of curcumin (CUR), demethoxycurcumin (DMC) and bisdemethoxycurcumin (BDMC), and tetrahydrocurcumin (THC) (C-F: n = 4, mean ± SEM).
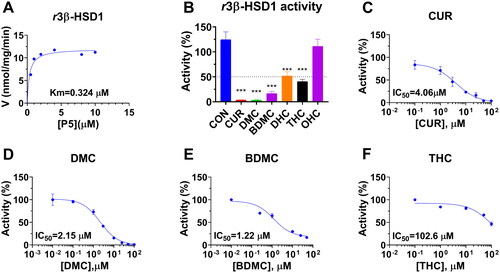
Figure 6. Enzyme kinetics-inhibition and Lineweaver-Burk plot analysis of curcumin analogues on rat 3β-HSD1: Enzyme kinetics-inhibition analysis for curcumin (CUR), demethoxycurcumin (DMC) and bisdemethoxycurcumin (BDMC) (A-C); Lineweaver-Burk plot analysis for CUR, DMC, and BDMC (D-F), n = 3–4.
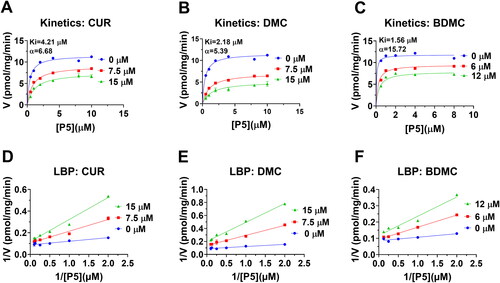
Figure 7. Molecular docking of curcumin (CUR), demethoxycurcumin (DMC) and bisdemethoxycurcumin (BDMC) with human 3β-HSD2: 3D model (cyan, A) and 2 D model (purple, B) of P5 with h3β-HSD2; 3D superimposed image of CUR (C) DMC (E), BDMC (G): curcuminoid (red) occupies P5 (cyan) binding site; 2D superimposed image of CUR (D), DMC (F), BDMC (H): each curcuminoid (purple) overlaps P5 (cyan) contact residues (red circle) with the hydrogen bond (dotted line).
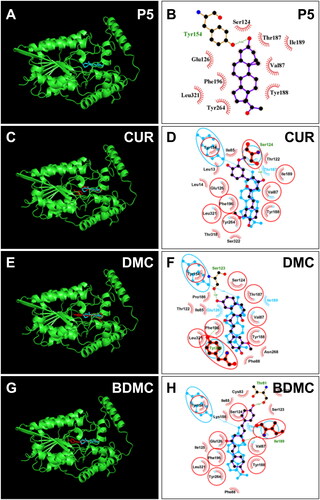
Figure 8. Molecular docking of curcumin (CUR), demethoxycurcumin (DMC) and bisdemethoxycurcumin (BDMC) with rat 3β-HSD1: 3D model (cyan, A) and 2 D model (purple, B) of P5 with r3β-HSD1; 3D superimposed image of CUR (C) DMC (E), BDMC (G): curcuminoid (red) occupies P5 (cyan) binding site; 2D superimposed image of CUR (D), DMC (F), BDMC (H): each curcuminoid (purple) overlaps P5 (cyan) contact residues (red circle) with the hydrogen bond (dotted line).
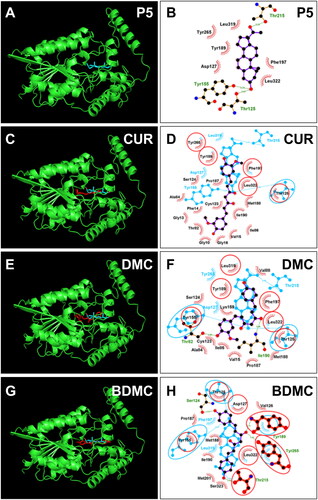
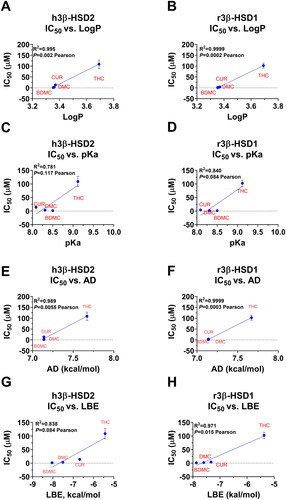
Figure 9. IC50 values dependence on LogP (A&B), pKa (C&D), AD (apolar desolvation, E&F), and LBE (lowest binding energy, G&H) in h3β-HSD2 (A, C, E, G) and r3β-HSD1 (B, D, F, H). Pearson correlation values were calculated. Mean ± SEM, n = 4.