
Figures & data
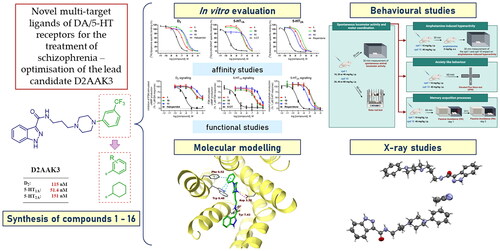
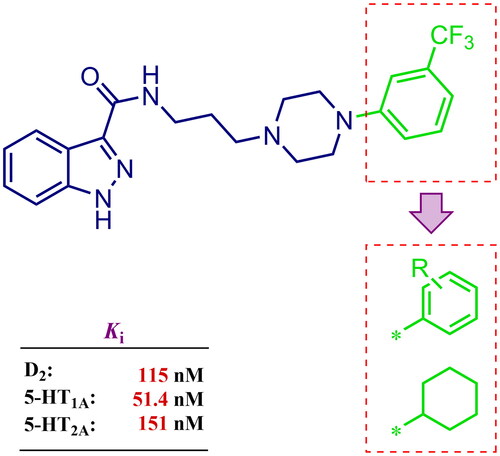
Figure 1. Chemical structure of D2AAK3 and its structural modifications designed in the optimisation process.
Scheme 1. Synthetic route for compounds 1–16. Reagents and conditions: (i) 1,3-dibromopropane, K2CO3, butan-2-one, reflux, 10 h; yield: 78%; (ii) N-substituted piperazine, K2CO3, KI(cat.), ACN, reflux, 5–22 h; yield: 35–98%; (iii) NH2NH2·H2O, EtOH 96%, reflux, 3 h; yield: 18–95%; (iv) 1H-indazole-3-carboxylic acid, CDI, DMF, 60 °C, 2 h → 4.5 h; yield: 20–80%.
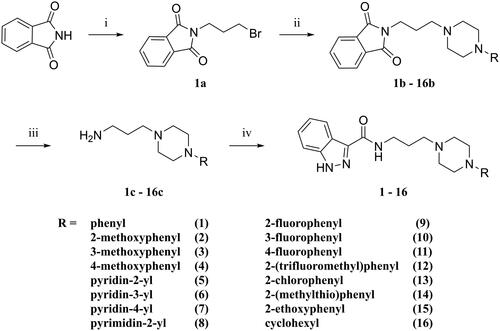
Figure 2. Competition radioligand binding curves for compounds 1, 10, and 11 and standard competitor ligands at human cloned D2, 5-HT1A, and 5-HT2A receptors. The graphs show the data (mean ± SEM) of a representative experiment out of 2–5 (D2), 2–3 (5-HT1A), or 2 (5-HT2A) independent experiments performed in duplicate.
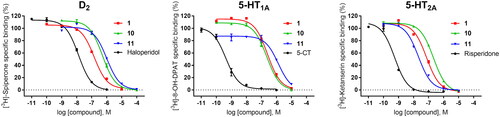
Table 1. Competitive radioligand binding data at human D2, 5-HT1A, and 5-HT2A receptors.
Table 2. Competitive radioligand binding data for compounds 1, 10, and 11 at human D1, D3, 5-HT7, H1, and M1 receptors.
Figure 3. Concentration–response curves of compounds 1, 10, 11, and reference ligands haloperidol (as D2 antagonist), 5-CT (as 5-HT1A agonist), and risperidone (as 5-HT2A antagonist) in functional assays of cAMP signalling (D2, 5-HT1A) and IP production (5-HT2A). Data are expressed as % of 1 µM dopamine (DA) response (A), % of 1 µM forskolin (FSK)-stimulated cAMP production (B), and % of 1 µM serotonin (5-HT) response (C). The graph shows data (mean ± SEM) of 2–3 (D2, 5-HT1A) or 4–5 (5-HT2A) independent experiments performed in duplicate.
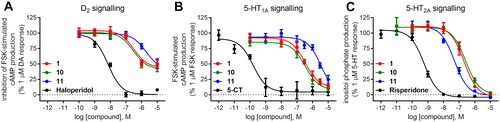
Table 3. Potency and efficacy of selected compounds at D2, 5-HT1A, and 5-HT2A receptor signalling.
Figure 4. Compounds 1 (A, B) and 10 (C, D) in the binding pocket of the human dopamine D2 receptor. (A, C) 3D view of the binding site. Ligands are represented as sticks with green carbon atoms. Protein is represented as yellow ribbons, main interacting residues are shown as sticks with grey carbon atoms. Electrostatic interactions are shown as pink dashed lines, hydrogen bonds as yellow dashed lines, π–π stacking as light blue dashed lines. Non-polar hydrogen atoms were omitted for clarity. (B, D) 2D view of the binding site.
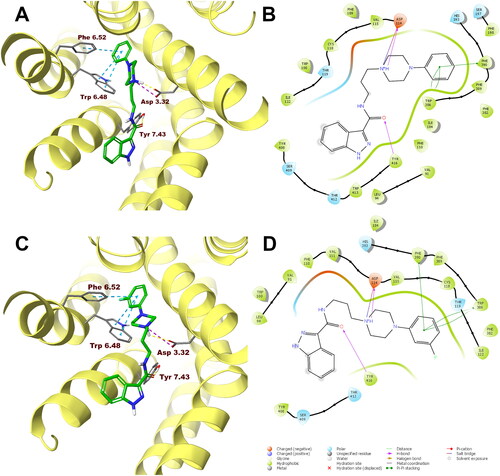
Figure 5. Compounds 1 (A, B) and 10 (C, D) in the binding pocket of the human serotonin 5-HT1A receptor. (A, C) 3D view of the binding site. Ligands are represented as sticks with green carbon atoms. Protein is represented as yellow ribbons, main interacting residues are shown as sticks with grey carbon atoms. Electrostatic interactions are shown as pink dashed lines, hydrogen bonds as yellow dashed lines, π–π stacking as light blue dashed lines. Non-polar hydrogen atoms were omitted for clarity. (B, D) 2D view of the binding site.
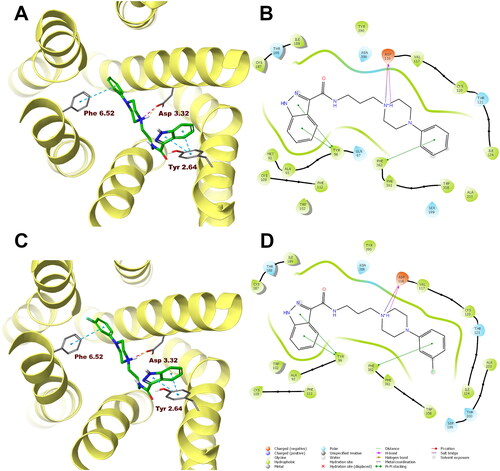
Figure 6. Compounds 1 (A, B) and 10 (C, D) in the binding pocket of the human serotonin 5-HT2A receptor. (A, C) 3D view of the binding site. Ligands are represented as sticks with green carbon atoms. Protein is represented as yellow ribbons, main interacting residues are shown as sticks with grey carbon atoms. Electrostatic interactions are shown as pink dashed lines, hydrogen bonds as yellow dashed lines, π–π stacking as light blue dashed lines. Non-polar hydrogen atoms were omitted for clarity. (B, D) 2D view of the binding site.
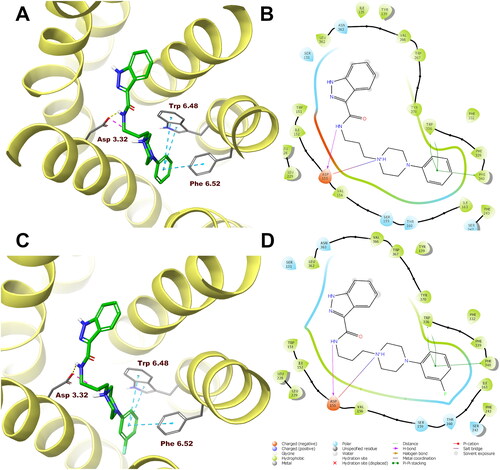
Figure 7. Molecular structure of compound 1 with atoms and molecules labelling scheme.
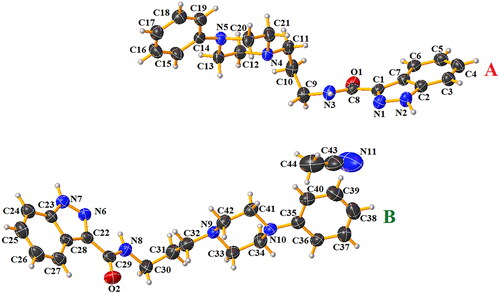
Table 4. Hydrogen bonding geometry (Å, °) for compound 1.
Figure 8. Acute effects of compound 1 (A) and compound 10 (B) on locomotor activity in mice. Compound 1 (10, 20, and 40 mg/kg, n = 8, i.p.), compound 10 (20, 40, and 80 mg/kg, i.p., n = 6–8), or vehicle (n = 8) were administered and after 30 min, the mouse locomotor activity was recorded for 30 min. Bonferroni’s post hoc test revealed the decrease in animal locomotor activity after the administration of compound 1 at the dose of 20 and 40 mg/kg (p < 0.05).
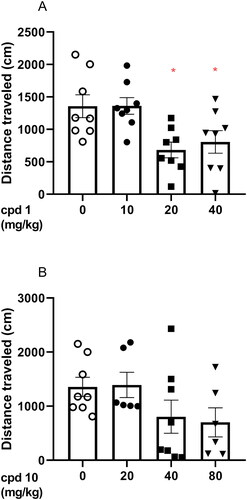
Figure 9. Influence of compounds 1 and 10 on hyperactivity induced by amphetamine in mice. Appropriate treatment groups received 10 mg/kg compound 1 (n = 8, i.p.), 40 mg/kg compound 10 (n = 8), 5 mg/kg amphetamine (n = 8, s.c.), 10 mg/kg compound 1 co-administered with amphetamine (n = 8), 40 mg/kg compound 10 co-injected with 5 mg/kg amphetamine (n = 8), and vehicle (n = 8) indicated as 0. Animals were injected with each compound or vehicle and received the second injection with vehicle or amphetamine 30 min after the first injection. The spontaneous locomotor activity was recorded for 30 min after the second injection. Data are presented as the mean ± SEM of the distance travelled (cm) by the mouse. Bonferroni’s post hoc test results: ****p < 0.0001 amphetamine vs. the control group and ^^^^p < 0.0001 for compound 1 or compound 10 co-administered with amphetamine vs. amphetamine-treated group (presented in panels A and B, respectively).
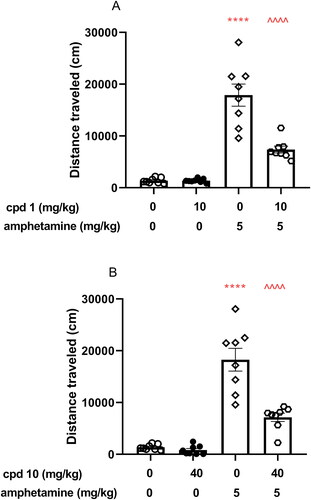
Figure 10. Influence of compounds 1 and 10 on memory acquisition in mice. Appropriate groups were injected with 10 mg/kg compound 1 (n = 10, i.p.), 40 mg/kg compound 10 (n = 10, i.p.), and vehicle (n = 9, i.p.) 60 min before the PA test. There is a lack of statistically significant difference between groups (one-way ANOVA, p > 0.05).
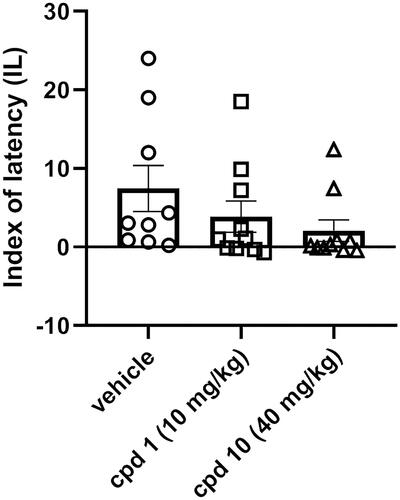
Figure 11. Acute effects of compounds 1 and 10 on anxiety-like behaviour in mice. Appropriate groups were administered with 10 mg/kg compound 1 (n = 8, i.p.), 40 mg/kg compound 10 (n = 7, i.p.), and vehicle (n = 9) 60 min before the EPM test. The values represent the mean ± SEM of percentage of open arms time (A), percentage of open arm entries (B), and closed arm entries (C).
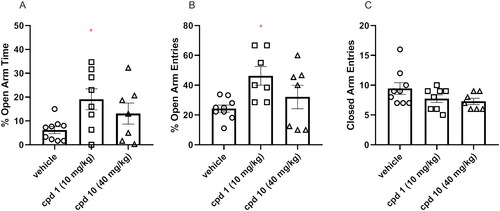
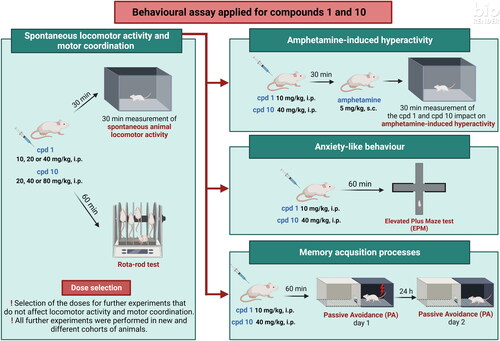
Figure 12. Graphical representation of the applied protocol for behavioural experiments.
Supplemental Material
Download PDF (5.9 MB)Data availability statement
The data that support the findings of this study are available in the Supplementary Information of this article.