
Figures & data
Figure 1. The chemical structures of known inhibitors of Hsp90.
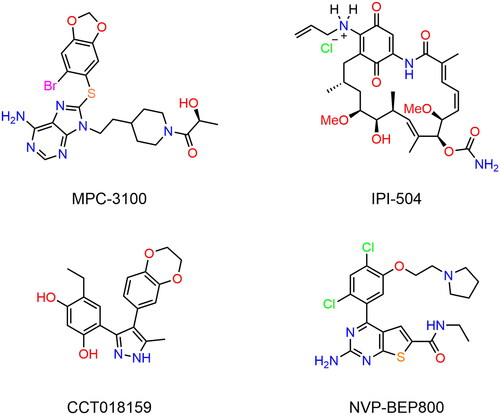
Figure 2. The pharmacophore model of Hsp90. The hydrogen-bond donor (F1) and aromatic centre (F2) were indicated by green and orange spheres, respectively. The two hydrophobic centroid features F3 and F4 were indicated by yellow spheres. The dashed black line represented hydrogen-bond interaction. Each key residue was annotated with a three-letter amino acid code.
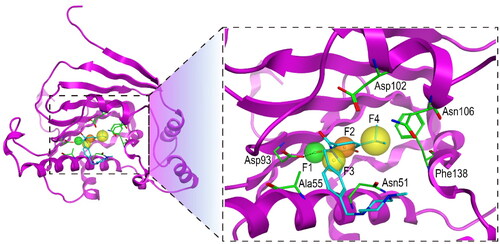
Figure 3. ROC curve of the generated Hsp90 pharmacophore model.
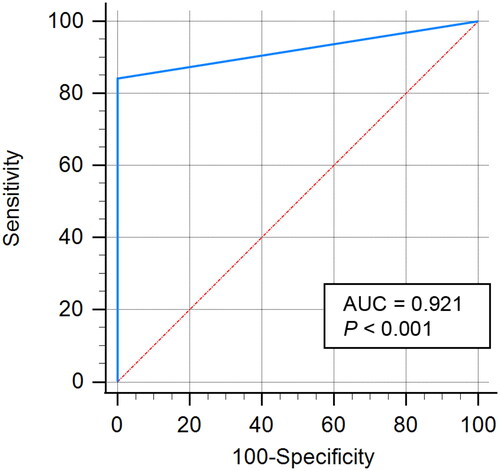
Figure 4. The protocol for virtual screening and biological evaluation of Hsp90 inhibitors.
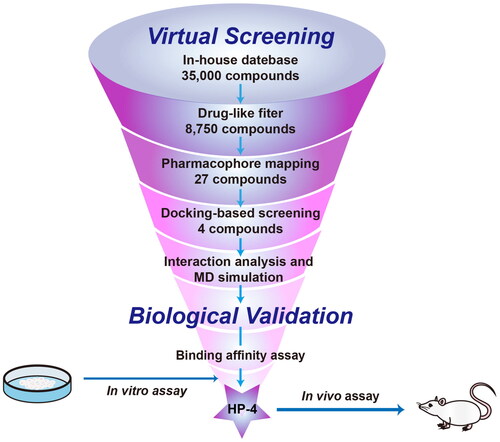
Figure 5. The chemical structures of HPs 1–4.
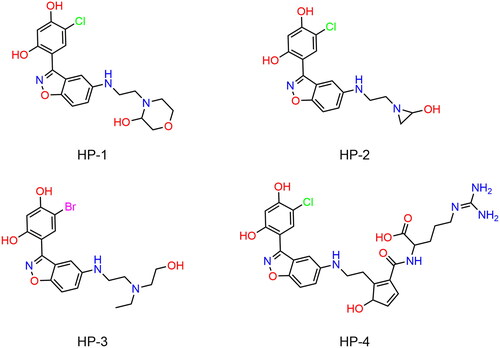
Table 1. The drug-like properties, docking sores and biological data of HPs 1–4 and MPC-3100.
Figure 6. The docking modes of HPs 1–4 with key residues of Hsp90. (A) HP-1; (B) HP-2; (C) HP-3; (D) HP-4. The dashed black line represents hydrogen-bond interaction.
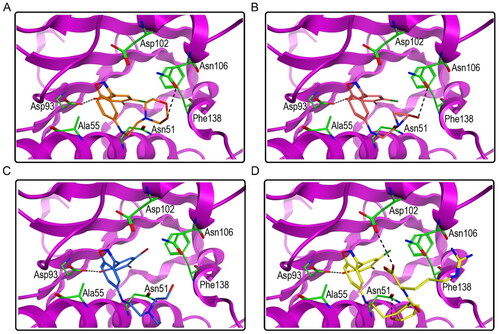
Figure 7. RMSD of atoms during MD simulations. (A, B) RMSDs of HP-1-Hps90 complexes and HP-1, respectively; (C, D) RMSDs of HP-2-Hps90 complexes and HP-2, respectively; (E, F) RMSDs of HP-3-Hps90 complexes and HP-3, respectively; (G, H) RMSDs of HP-4-Hps90 complexes and HP-4, respectively;.
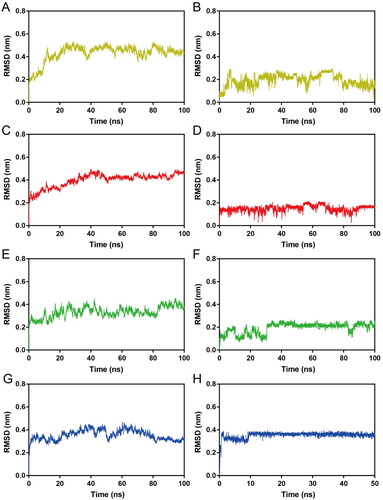
Figure 8. (A–D) RMSF of Cα atoms of Hsp90 residues in HPs 1–4-Hsp90 complexes, respectively. The colour code is HP-1-Hsp90 (yellow), HP-2-Hsp90 (red), HP-3-Hsp90 (green), and HP-4-Hsp90 (bule). (E–H) Secondary structure of Hsp90 in HPs 1–4-Hsp90 complexes, respectively.
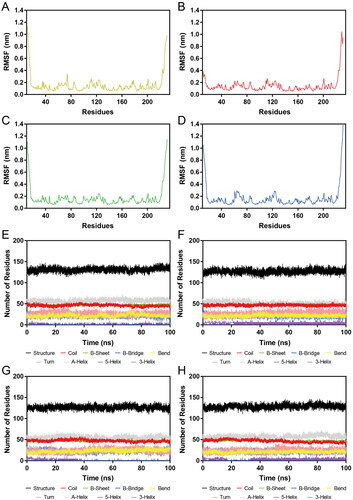
Figure 9. The docking modes of HPs 1–4 and the original ligand bind to the ATP-binding pocket of NTD of Hsp90.
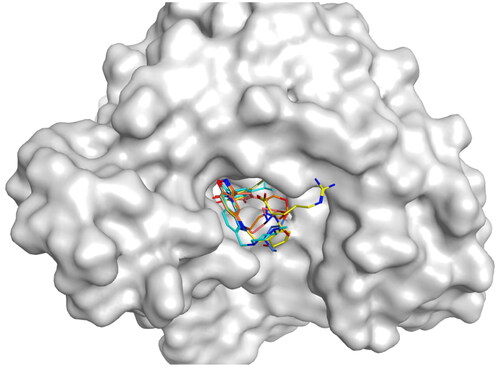
Figure 10. The cytotoxicity of MPC-3100 and HPs 1–4 against human colon cancer HCT-116 cells.
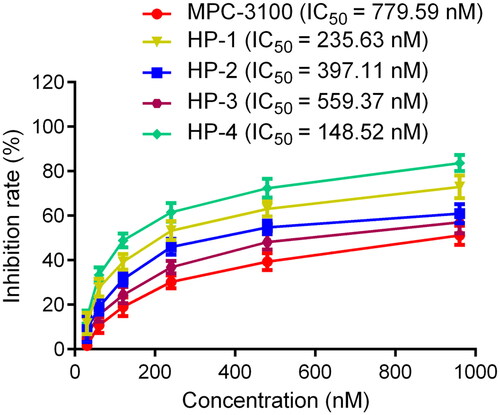
Table 2. Biochemical profile of HP-4.
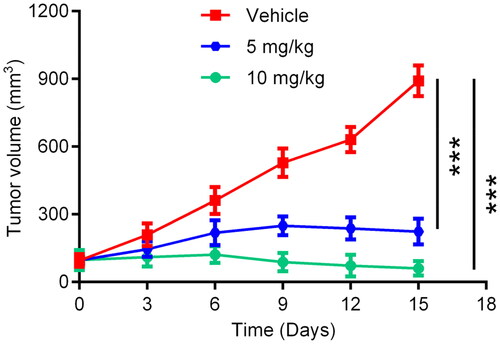
Figure 11. In vivo anti-tumour effects of HP-4. Data are represented as mean ± SD, n = 5. ***p < 0.001.
Data availability statement
The original contributions presented in the study are included in the article/supplementary material, further inquiries can be directed to the corresponding author/s.