
Figures & data
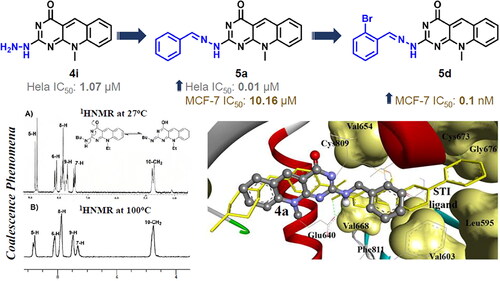
Figure 1. Structure of 5-deazaflavin skeleton.
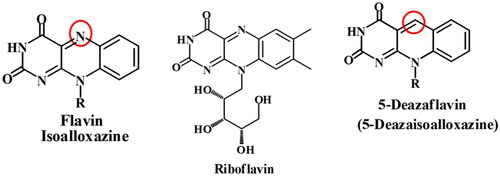
Figure 2. Structures 5-deazaflavins anticancer agents and their structural similarity to the well-known kinase inhibitors imatinib.
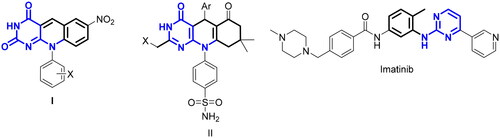
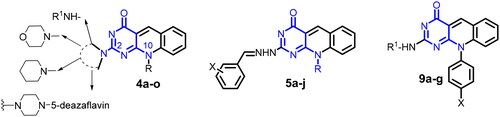
Figure 3. General structure of the targeted 5-deazaflavins as novel anticancer agents.
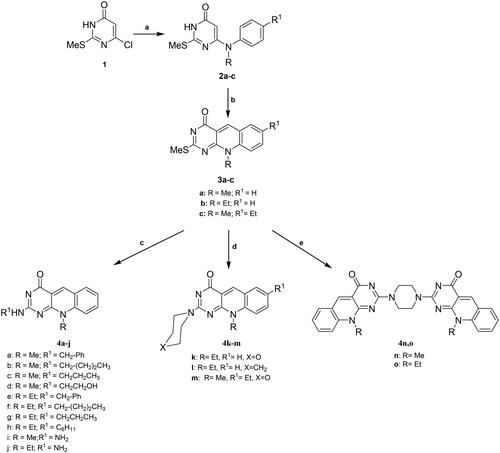
Scheme 1. General method for the preparation of 6-(N-Alkyl substituted anilino)-2-methylthiopyrimidin-4(3H)-ones (2a–c), 7-(unsubstituted/substituted)-10-alkyl-2-deoxo-2-methylthio-5-deazaflavins (3a–c), 2-(N-substituted amino-10-alkyl-2-deoxo-5-deazaflavins (4a–h), 2-hydrazino-10-alkyl-2-deoxo-5-deazaflavins (4i, j), 2-(heterocyclic amino)-7-(unsubstituted/substituted)-10-alkyl-2-deoxo-5-deazaflavins (4k-m), and 2,2'-(Piperazine-1,4-diyl)bis(10-alkyl-2-deoxo-5-deazaflavins) (4n,o). Reagent and conditions: (a) N-alkyl aniline, n-butanol, reflux, 24–48 h; (b) DMF-POCl3, 90 °C, 1–1.5 h; (c) primary aliphatic amine, benzylamine or hydrazine hydrate, EtOH, reflux, 2–4 h; (d) secondary heterocyclic amine, EtOH, reflux, 6–7 h; (e) piperazine, EtOH, reflux, 6.5–7 h.
Scheme 2. General method for the preparation of 2[(E)-2-(substituted)benzylidenehydrazino]-10-alkyl-2-deoxo-5-deazaflavins (5a–j). Reagent and conditions: aromatic aldehyde, EtOH, reflux, 2–3 h.
![Scheme 2. General method for the preparation of 2[(E)-2-(substituted)benzylidenehydrazino]-10-alkyl-2-deoxo-5-deazaflavins (5a–j). Reagent and conditions: aromatic aldehyde, EtOH, reflux, 2–3 h.](/cms/asset/17f2db1d-3590-4110-a779-d64d62c6f716/ienz_a_2220570_sch0002_b.jpg)
Scheme 3. General method for the preparation of 10-aryl-2-deoxo-2-thioxo-5-deazaflavins (8a–c) and 2-(substituted amino)-10-aryl-2-deoxo-5-deazaflavins (9a–h). Reagent and conditions: (a) arylamine, anilinium chloride, 170 °C, 9 h; (b) o-bromo-benzaldhyde, DMF, 110 °C, 1.5–2 h; (c) primary aliphatic amine, EtOH, reflux, 5–7 h.
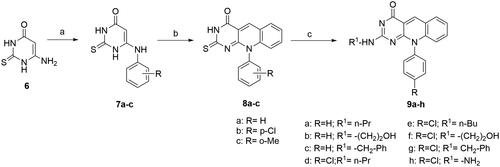
Figure 4. The 1H-NMR spectra for compound 4f at 27 °C exhibiting the coalescence phenomenon (A) and at 100 °C (B) in DMSO-d6, showing a single conformation spectrum.
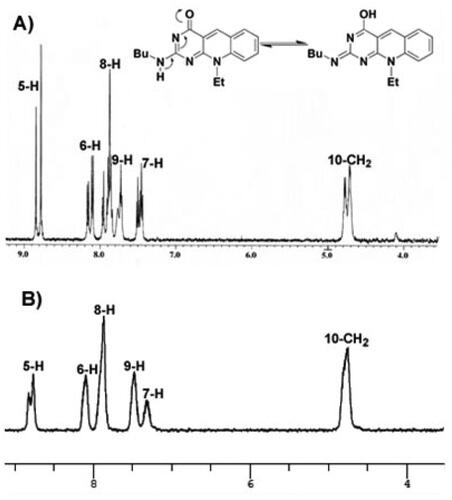
Figure 5. 1HNMR spectrum of compound 4n.
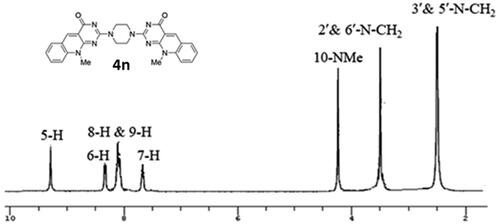
Figure 6. UV–VIS spectra of 3c, 4d, 4m, and 4o.
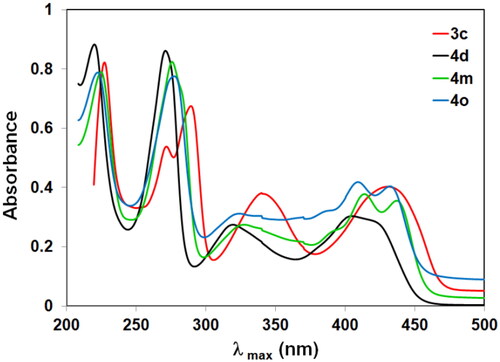
Table 1. Antiproliferative activity (IC50; µM) of compounds (4a, 4e, 4i, 4j, 4k, 4m, 4n, 4o, 5a–j, 8a–c, and 9a–h) against MCF-7 and Hela cell lines.
Table 2. % Activity or corresponding % inhibition of 20 kinases in the presence of 2 compounds and a reference compound (Imatinib) using the radiometric assay method.
Figure 7. Annexin V FITC/PI apoptosis assay for MCF-7 cells treated separately with compounds (4d and 9f), at different concentrations (1, 5, and 10 μM) for 72 h. X-axis is annexin V and Y-axis is PI for each compound. C1 (upper left): necrotic cells (PI+/annexin V−); C2 (upper right): late apoptotic (PI+/annexin V+); C3 (lower left): live cells (PI−/annexin V−); C4 (lower right): early apoptotic cells (PI−/annexin V+). The data shown are the mean % cell number ± SD (n = 3).
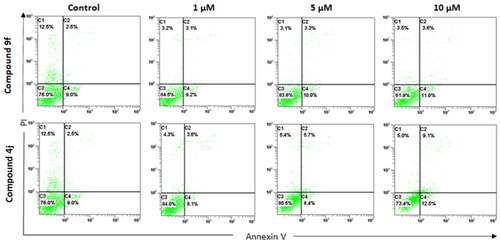
Figure 8. Docking validation of the reproducibility of GOLD 5.2.2. program for redocking of the co-crystalized ligands (ball and sticks coloured by elements) into their corresponding binding sites of (A) ABL (PDB: 2hyy); (B) c-Kit (PDB: 1t46), (C) B-Raf (PDB: 4rzv); (D) FAK (PDB: 4q9s), (E) FLT1 (PDB: 3hng); and (F) SRC (PDB: 4mxo) kinases compared to the native bound ligand (in sticks). The hydrogen bonds are shown in dashed lines.
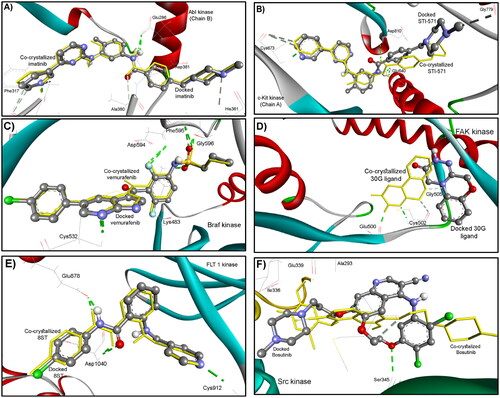
Table 3. Docking score results for the synthesised 5-deazaflavin analogs docked into six different kinases in comparison to the corresponding native bound inhibitor using the gold molecular docking program.
Figure 9. (A) The molecular overlay view of Abl (PDB: 2hyy), c-kit (PDB: 1t46), FAK (PDB: 4q9s), Src (PDB: 4mxo), B-raf (PDB: 4rzv), and FLT1 (PDB: 3hng) kinases showing the binding site in yellow surface view. (B) The binding mode of compound 5d into SCR kinase (PDB: 4mxo) reveals three hydrogen bonds with Met341, Glu339, and Asp404 amino acids. (C) The docking pose of compound 9f into C-Kit kinase (PDB: 1t46) within RMSD of 1.79 Å from the co-crystalized TI-571 ligand and exhibiting four hydrogen bonds with Glu640, Asp810, and Cys673 amino acids.
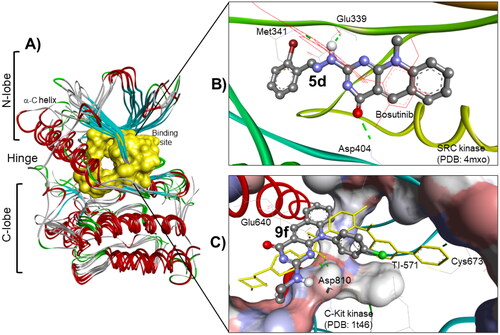
Table 4. Docking results for the synthesised 5-deazaflavin analogs docked into c-Kit receptor PTK (PDB: 1t46) in comparison to the native bound inhibitor STI-571(Imatinib), considering the binding free energies (ΔGb) and inhibition constants (Ki).
Figure 10. The comparative AutoDock binding affinities of compound 4a (coloured by element, balls, and sticks) involving flexible docking into the binding pocket of the c-Kit PTK (1t46), shown as solid backbone ribbon with the STI ligand (dark sticks). The hydrogen bonds are shown as dashed lines.
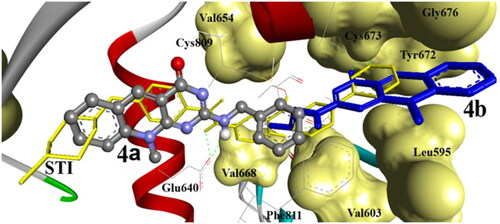
Figure 11. The binding affinity of compound 4m (balls and sticks) into c-Kit PTK (1t46). It exhibited one hydrogen bond with SH of Cys788. The binding site of the PTK is shown as a solid surface with labelled amino acids, STI cocrystallized ligand is shown as light sticks. The hydrogen bonds are shown as dashed lines.
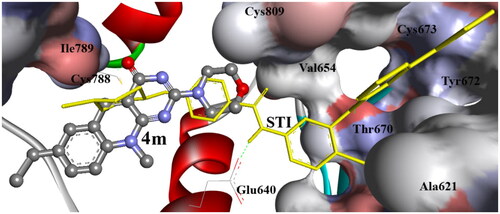
Figure 12. The comparative AutoDock binding affinities of compound 4e (coloured by element, balls, and sticks) and 5d (sticks) involving flexible docking into the binding pocket of the c-Kit PTK (1t46), shown as solid backbone ribbon with the STI ligand (lines) The hydrogen bonds are shown as dashed lines.
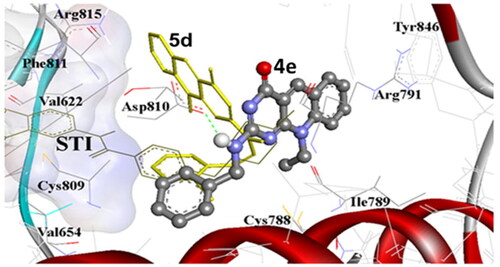
Figure 13. (A) Correlation between the IC50 (µM) against MCF-7 tumour cell lines and AutoDock binding free energy (ΔGb) for compounds 4e, 4i, 4n, 5a, 5c, 5d, 5f, 5i, 5j, 9d, and 9f. (B) correlation between the IC50 (µM) against MCF-7 tumour cell lines and AutoDock predicted inhibition (Ki) for compounds 4e, 4i, 4n, 5a, 5c, 5d, 5f, 5i, 5j, 9d, and 9f.
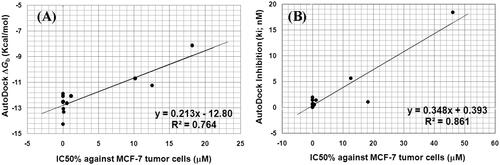
Figure 14. Predicted boiled-egg plot from SwissADME online web tool for compounds 4j, 5d, 5f, and 9f.
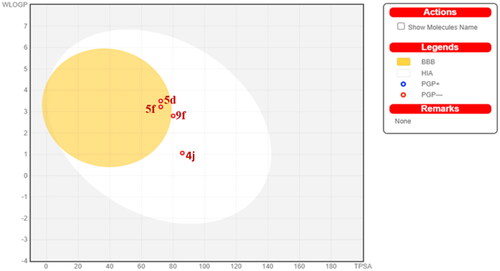
Figure 15. In vivo study of compound 2a with a 5-deazaflavin scaffold indication non-toxic effect after 14 days administration in nude mice. Adopted from our research group publication (PubMed PMID: 17049252)Citation2.
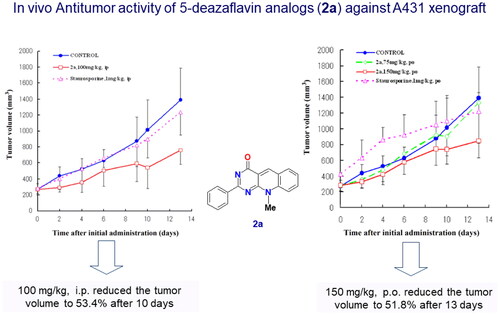
Table 5. Predicted toxicity study of the most potent compounds (4e, 4j, 4k, 5d, and 9f) using toxicity model computation and SWISS ADME calculation.