
Figures & data
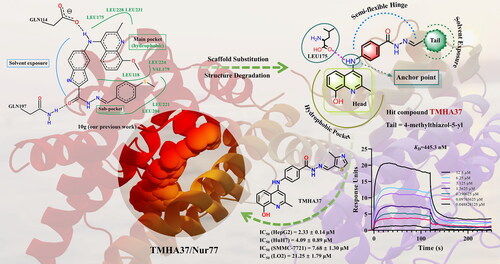
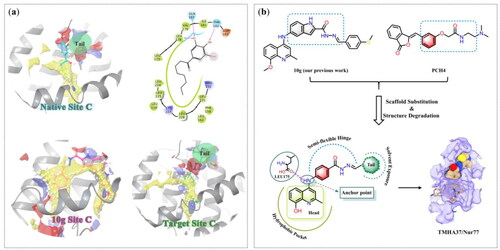
Figure 1. Design strategy of novel Nur77 modulators.
Scheme 1. The synthesis of compound N1-N15 and 7A-7V. Reagents and conditions: (a) Polyphosphoric acid, ethyl acetoacetate, 120 °C; (b) POCl3, 130 °C; (c) BBr3, room temperature, 6 h. (d) Benzocaine, n-Butanol, concentrated hydrochloric acid, reflux; (e) Hydrazine hydrate, ethanol, reflux; (f) Ethanol, RCHO, trifluoroacetic acid, reflux.
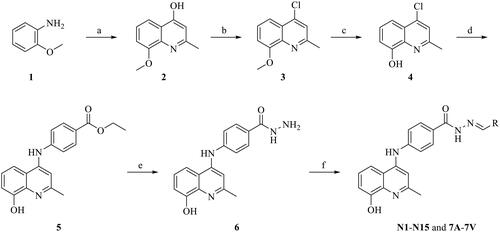
Table 1. In vitro antiproliferative activities of compounds 7A–7V against four liver cell lines. 
Figure 2. Induced fit docking study of target compounds with Nur77 at Site C. (a) Venn diagram analysis of the top five docked conformations of each complex with both docking scores <−9.5 and IFDscore <−488.50. (b) Average binding volumes of the top-five docking poses of Nur77 in complex with N4, N9, N12, 7P, and TMHA37, respectively. (c) Binding volumes of the top-five docking poses of N4, N9, N12, 7P, and TMHA37 with Nur77, respectively. (d) Binding pose metadynamics of the top-ranked docking poses.
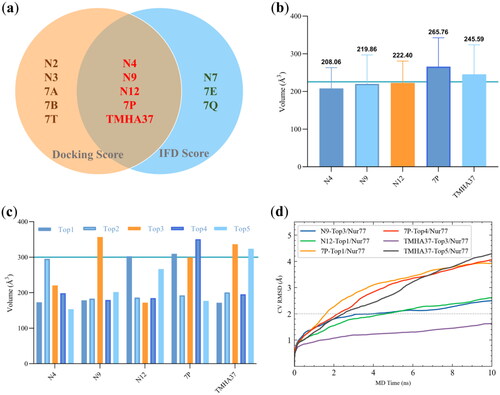
Figure 3. MD simulation of TMHA37/Nur77 system at Site A-C. (a) Binding patterns of native ligand TMY with Nur77 at Site A (PDB No: 3V3Q). Nur77 was represented as silver bands, TMY was shown as red spheres, and the binding pocket was shown as a yellow surface. (b) Binding patterns of native ligand TMY with Nur77 at Site B (PDB No: 3V3Q). Nur77 was represented as silver bands, TMY was shown as sky blue spheres, and the binding pocket was shown as a magenta surface. (c) Binding patterns of native ligand 3NB with Nur77 at Site C (PDB No: 4WHG). Nur77 was represented as silver bands, 3NB was shown as green spheres, and the binding pocket was shown as a green surface. (d–f) Docking poses of TMHA37 with Nur77 at Site A (d), Site B (e), and Site C (f), respectively. (g–i) Binding pose metadynamics simulations of native Nur77 system versus TMHA37/Nur77 system at Site A (g), Site B (h), and Site C (i), respectively. (j-l) RMSD profiling of TMHA37/Nur77 system at Site A (j), Site B (k), and Site C (l), respectively. The green lines indicated protein backbone RMSD, firebrick lines indicated the RMSD of ligand fit on protein, and violet lines indicated the RMSD of ligand fit on ligand. (m–o) Timeline representations of the contacts and interactions between TMHA37 and Nur77 at Site A (m), Site B (n), and Site C (o), respectively. The top panel showed the total number of specific contacts the protein made with the ligand over the course of the trajectory. The bottom panel showed which residues interact with the ligand in each trajectory frame.
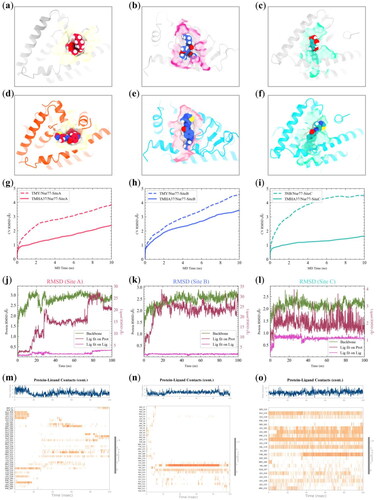
Figure 4. 500 ns MD simulation of TMHA37/Nur77-SiteC complex. (a) RMSD analysis of Apo-Nur77 (blue line) and Holo-Nur77 system (green line). The heavy atom RMSD of TMHA37 was shown as orange line. (b) The histogram of protein backbone RMSD distribution of Apo-Nur77 (blue) and Holo-Nur77 system (green). (c) Protein Ca RMSF plot of the simulated systems. (d) Time evolution of radius of gyration (Rg). (e) Ligand binding solvent accessible surface area (SASA). (f) Hydrogen bonds analysis of Holo-Nur77 system during MD simulation. (g) Protein-ligand contacts analysis of TMHA37/Nur77-SiteC. The green bars denoted hydrogen bonds, light violet bars denoted hydrophobic contacts, and blue bar denoted water bridges. (h) Ligand-protein contacts plot of TMHA37/Nur77-SiteC system. Whereas violet and red colored arrows denoted the hydrogen bonds and pi-cation interactions, respectively. (i) Timeline plots of the contacts and interactions between TMHA37 and Nur77.
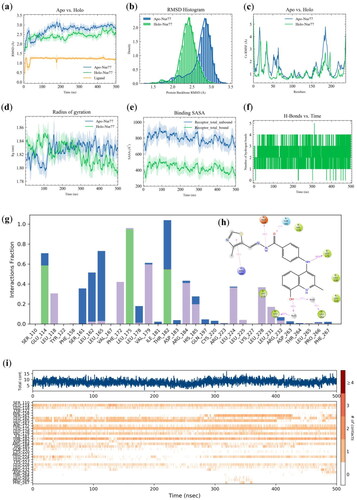
Figure 5. Conformational analysis of TMHA37/Nur77-SiteC complex. (a) The FEL plot obtained during 500 ns MD simulation for TMHA37/Nur77-SiteC system. The dark brown area denotes the energy minima, and the white and light-yellow regions describe metastable conformational states. (b) Binding pose of the free energy minimum conformation colored by hydrophobicity. Nur77 was displayed as a cyan (hydrophilic) and yellow (hydrophobic) surface and TMHA37 was rendered in a yellow ball and stick. (c) and (d) represented 3D interactions between TMHA37 and Nur77 before (pre-MD) and after (post-MD) MD simulation, respectively. Site C of Nur77 was displayed as translucent stripes, TMHA37 was shown as ball and stick, and the key residues interacted with ligand were shown as colorful sticks. These sky-blue dashed lines indicated hydrogen bonds and brown-red dashed line indicated pi-cation interaction. (e) Time evolution of binding free energy (ΔG), lipophilic energy (Lipo), and Van der Waals energy (Vdw). (f) Total binding free energy and energy terms analysis for TMHA37/Nur77-SiteC system.
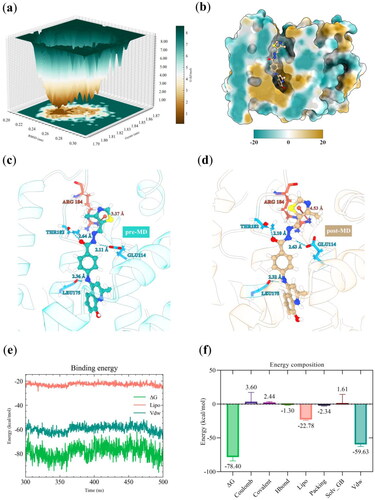
Figure 6. Binding assay of TMHA37 to Nur77-LBD. (a) The interaction between TMHA37 and Nur77-LBD was performed using SPR assay. (b) Hela cells were transfected with pG5-Luc reporter plasmid and pBind-Nur77-LBD and treated with the indicated concentration of TMHA37 or Cytosporone B (Csn B) for 24 hours. Reporter activities were measured. ***p < 0.001 (Student t test).
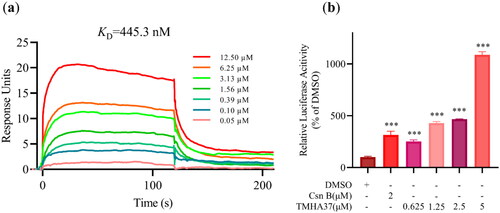
Figure 7. TMHA37 regulated the expression and mitochondrial targeting of Nur77. (a) Western blotting assays analyzed the expression of Nur77 in HepG2 cells after treating with 10 μM TMHA37 for the indicated time, β-actin was used for internal control. (b) 10 μM TMHA37 stimulated HepG2 cells for 3 h. Western blotting detected the distribution of Nur77 in the cytoplasm and nuclear. Lamin B1 and α-tubulin were used for the internal control of the nucleus and cytoplasm, respectively. (c) Confocal microscope observed the nuclear export of Nur77 in HepG2 cells treating with 10 μM TMHA37 for 6 h. DAPI was used as nuclei stanning dye. Scale bar, 20 μm. (d) HepG2 cells were exposed to 10 μM TMHA37 for 6 h and then probed with the Nur77 antibody and Mito-tracker. Scale bar, 20 μm.
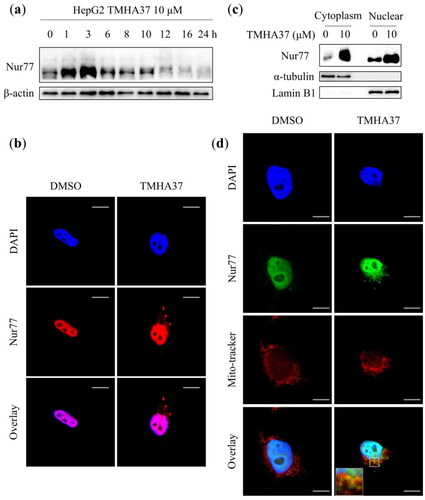
Figure 8. TMHA37 inhibited colony formation and induced cell cycle arrest at G2/M phase in HCC cells. (a) Effect of TMHA37 on the colony formation of Huh7 and HepG2 cells and Statistical analyses of the calculated colony number. HepG2 and Huh7 cells were treated with DMSO or TMHA37 for one week. Ns, not significant; ***p < 0.001; **0.001 < p < 0.01 (Student t test). (b) Effect of TMHA37 on cell cycle in Huh7 and HepG2 cells. Cells treated with TMHA37 at the indicated concentration for 10 h were analyzed by flow cytometry.
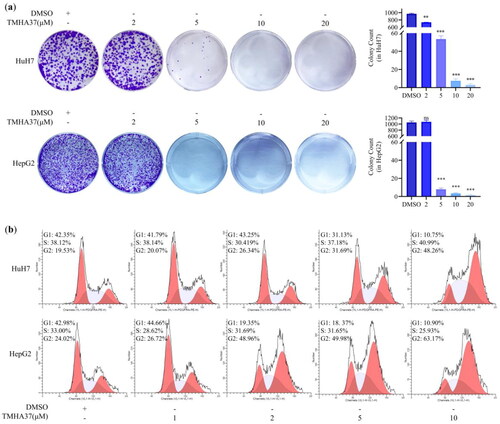
Figure 9. TMHA37 induces liver cancer cell apoptosis and autophagy. Western blot analysis of cleaved PARP and LC3-II after treatment with TMHA37 at the indicated concentration for 24 h in Huh7 (a) and HepG2 (b)cells. β-actin was used as an internal control. (c) Flow cytometry analysis of TMHA37, Q1: necrotic cells, Q2: viable apoptotic cells, Q3: nonviable apoptotic cells, Q4: normal cells; Huh7 and HepG2 cells treated with TMHA37 for 24 h were stained by FITC Annexin V and Propidium Iodide Staining Solution, and then analyzed by flow cytometry.
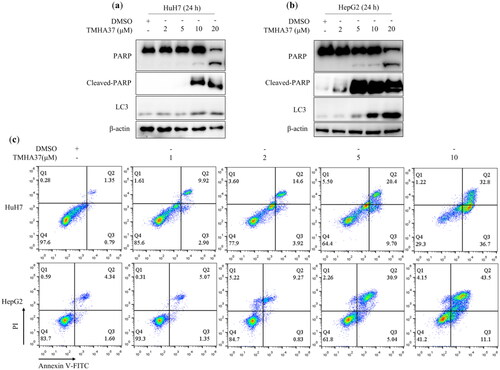
Figure 10. The effect of TMHA37 on inducing mitotic arrest and cell apoptosis in cancer cells was Nur77 dependent. (a) RT-QPCR analyzed the relative mRNA expression level in A549-WT or A549-Nur77-/- cells. (b) A549-WT or A549-Nur77-/- cells were treated with the indicated concentration of TMHA37 for 10 h were stained with DAPI for flow cytometry analysis. (c) Statistical analysis relative cell number in G2/M phase in A549-WT or A549-Nur77-/- cells. (d) Cleaved-PARP and Nur77 were detected by Western blotting after the treatment with TMHA37 for 24 h. (e) Cell viability of HepG2 cells with or without CDIM8. HepG2 cells were treated with 5 μM TMHA37 with or without CDIM8. After 48 h, the cell viability was determined by MTT assay.
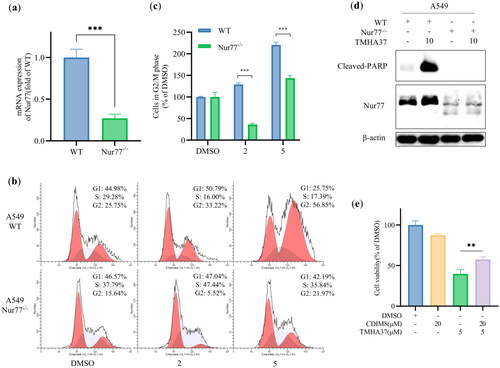
Table 2. PK profiles of compound TMHA37.