Figures & data

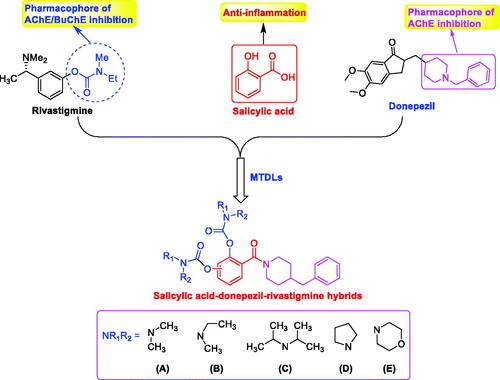
Figure 1. Design of salicylic acid–donepezil–rivastigmine hybrids.
Scheme 1. Synthesis of 5a–5h. Conditions: (i) EDCI, HOBT, THF, and room temperature. (ii) N,N-disubstituted carbamoyl chlorides (4a–4e), CH3CN, 65 °C.
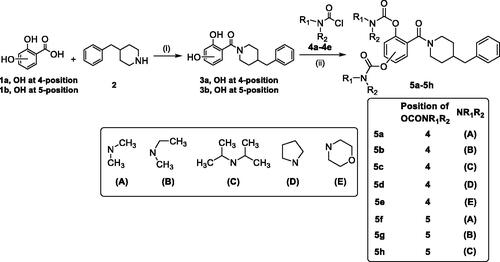
Table 1. The inhibitory capacity of AChE/BuChE by 5a–5h, rivastigmine and donepezil.
Figure 2. (A) BuChE recovery capability after preincubation of compound 5a was diluted to 0.1 × IC50. (B) The recovery capability of BuChE inhibition by rivastigmine, donepezil, and 5a was diluted to 0.1 × IC50 by monitoring with time for 240 min. The results were indicated as the mean ± SEM.
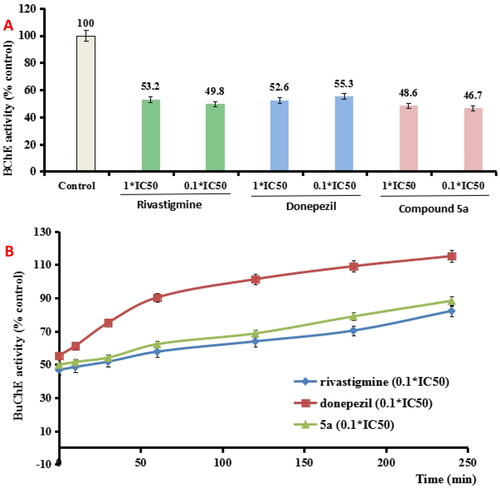
Figure 3. (A) 5a (green stick) interacted with the binding residues of huBuChE (PDB code: 4tpk). (B) 2D interaction of 5a (green stick) with huBuChE.
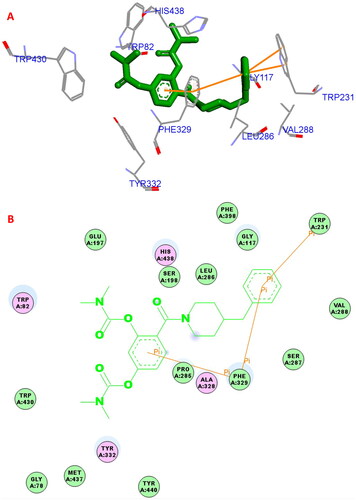
Figure 4. The cell viability was determined using CCK-8 assay. The results were indicated as the mean ± SD.
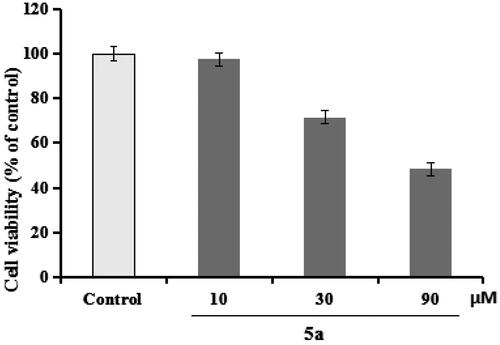
Figure 5. (A) Effects of compounds 5a and donepezil on the production of IL-6; (B) effects of compound 5a and donepezil on the production of IL-1β; (C) effects of compound 5a and donepezil on NO release. The results were expressed as the mean ± SD. *p < 0.05, **p < 0.01 vs. model group; ##p < 0.01 vs. control.
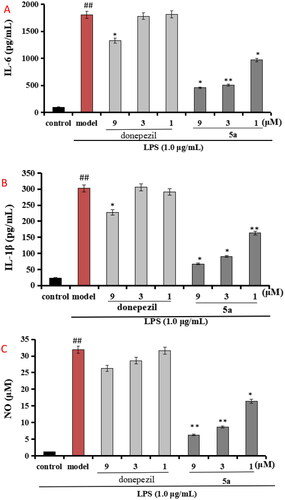
Figure 6. (A) The cytotoxicity of 5a. (B) Neuroprotective effects of compounds 5a and donepezil on Aβ25-35-induced PC12 cell injury by CCK-8 assay. Data were listed as the mean ± SD. *p < 0.05, **p < 0.01 vs. Aβ25-35-induced group; ##p < 0.01 vs. control group.
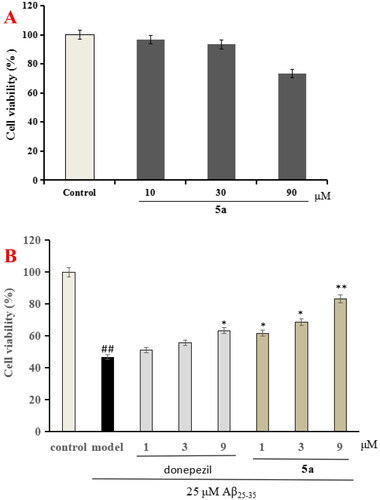
Figure 7. Stabilities of 5a in artificial gastrointestinal fluids (n = 3).
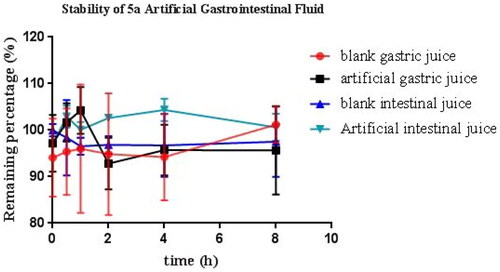
Figure 8. (A) Rat microsomes stability of 5a (n = 3); (B) plasma stability of 5a (n = 3).
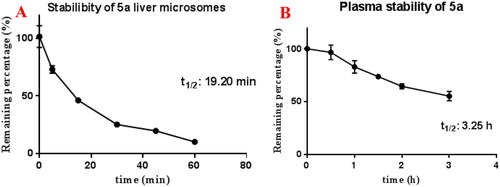
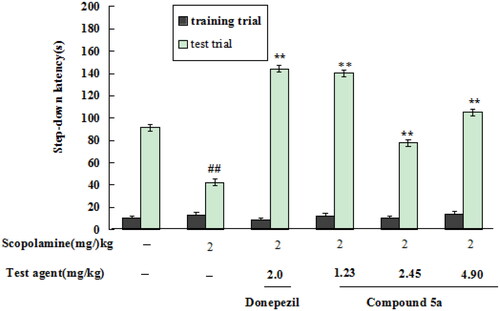
Figure 9. The in vivo effects of compound 5a and donepezil on scopolamine-induced cognitive dysfunction in mice. The results were indicated as the mean ± SD. **p < 0.01 vs. scopolamine-induced group; ##p < 0.01 vs. normal group.