Figures & data
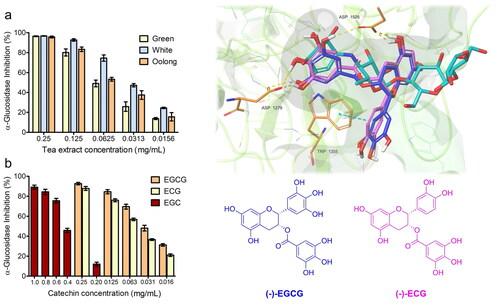
Table 1. Yields of extract (expressed as mg/g dry weight of tea leaves), TPC (expressed as mg GAE/g extract), and percentage of TPC/g dry weight of tea leaves.
Figure 1. Chemical structure of catechins and HPLC separation of green (a), white (b) and oolong (c) tea extract (1: EGC, 2: EC, 3: EGCG, 4: ECG).
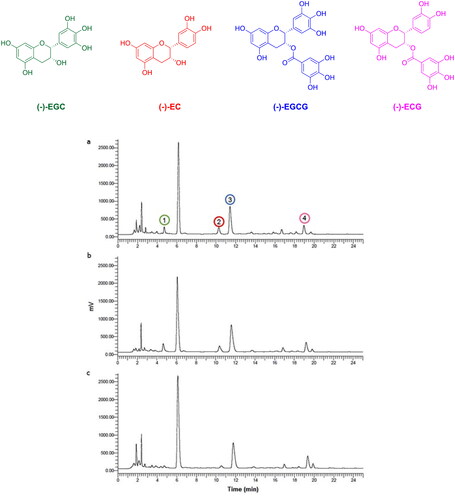
Table 2. Content of major catechins ECG, EC, EGCG, and EGC (expressed as mg/g dry weight of tea leaves) in green, (GTI) white (WTI), and oolong (OTI) tea infusions.
Figure 2. α-glucosidase inhibitory effect of the tea extracts (a), and standard catechins (EGCG, ECG, and EGC) (b) at different concentrations.
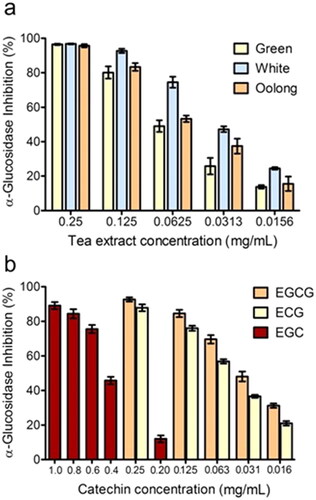
Table 3. α-Glucosidase Inhibition activity by the tea infusions (GTI, WTI, OTI), standard catechins (EGCG,ECG, EGC, EC), and commercial acarbose expressed as IC50 values.
Figure 3. Ligand interaction maps of co-crystallized acarbose and the docked compounds EGCG, EGC, EGC, and EC, obtained from AD4 calculation.
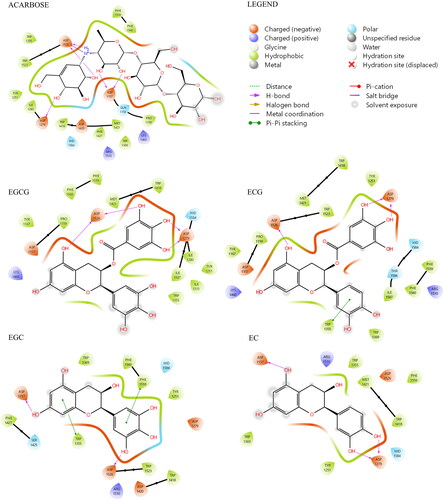
Figure 4. A) Superimposition between the best pose of EGCG obtained with AV (in yellow) and AD4 (in blue). B) Superimposition between the best pose of ECG by AV (in green) and AD4 (in violet).
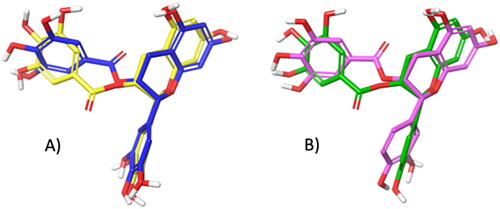
Figure 5. (A) Top-ranked energy pose of EGCG and ECG compounds within the acarbose-binding site of αG-C derived by in silico docking. The overall subunit is represented as a cartoon; the binding site is represented as molecular surfaces (light green); EGCG (blue), ECG (violet), co-crystallized acarbose (cyan) are in sticks; key residues are shown as orange tiny sticks. H-bonds are in yellow and pi-pi interactions are in cyan. Note EGCG and ECG T-shape and the portion of acarbose outside the binding pocket. B) Common epigallocatechin gallate skeleton indicating the conventional A-D ring system.
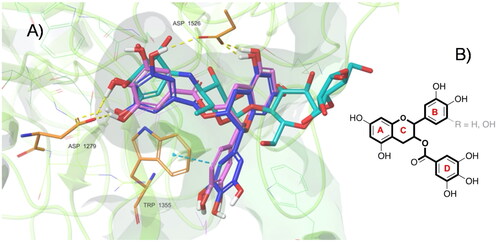
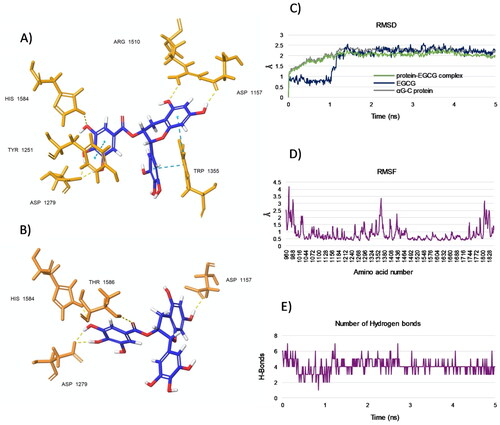
Figure 6. (A and B) Representative poses from two top-ranked clusters 1 and 2, respectively, displaying binding modes for EGCG within the acarbose-binding site of αG-C after MD simulation for 5 ns. The residues interacting with EGCG are shown. H-bonds are in yellow and pi-pi interactions are in cyan. (C) RMSD values from the starting protein structure (grey curve), the EGCG (blue curve) and the αG-C protein-EGCG complex (green curve) by MD simulations. Using the generated MD trajectories, RMSF (D) and HBs interactions (E) were also computed.