Figures & data
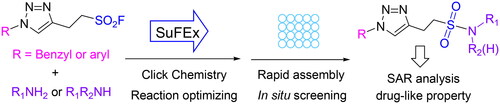
Figure 1. Lead discovery by SuFEx click chemistry, followed by direct screening against AChE and BuChE.
Scheme 1. Chemical structures of compounds T1–T17.
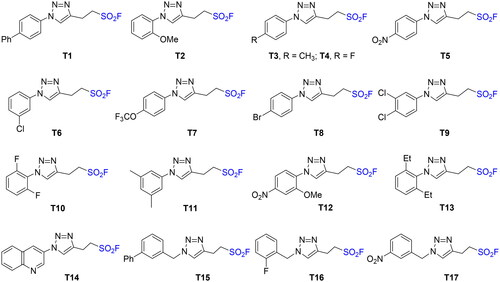
Figure 2. Potency and selectivity profile of inhibitory activity of compounds T1–T17 (A) and amines A1–A24 (B) against AChE and BuChE.
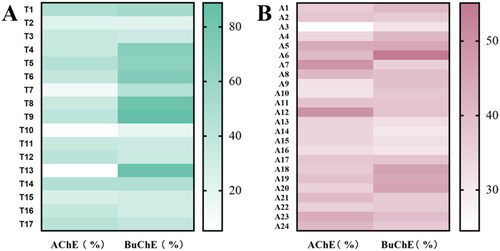
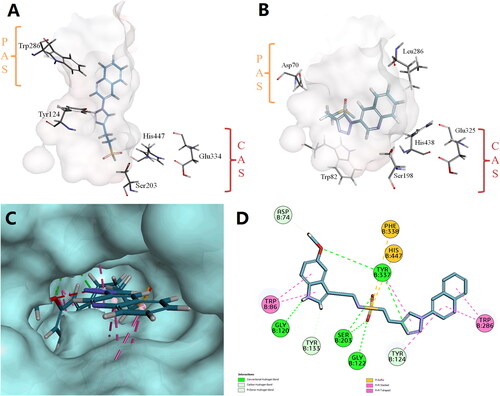
Figure 3. Binding orientation of T14 to the active site cavities of (A) hAChE (PDB ID: 4EY4) and (B) hBuChE (PDB ID: 6QAA). Top view of docking result (C) and 2-D (D) plots of T14-A24 onto hAChE (PDB: 4EY4).
Scheme 2. Chemical structures of purified compounds in milligram-scale.
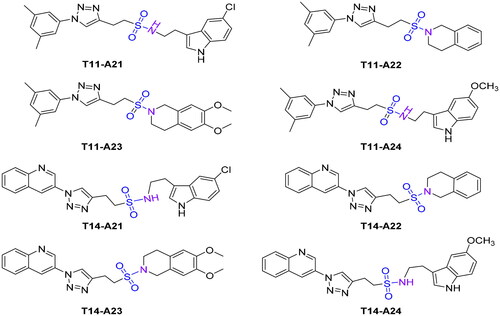
Figure 4. SuFEx-enabled high-throughput ChE screening. Scatter plot of % inhibition rates of reaction crudes at 20 µM.
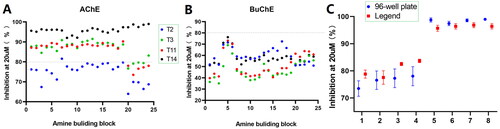
Figure 5. A: Relationship between eqBuChE inhibition and various concentrations of T14-A24; (B) Lineweaver–Burk plots of eqBuChE inhibition kinetics of T14-A24.
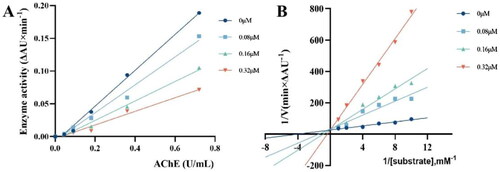
Table 1. Inhibitory activity on hAChE and hBuChETable Footnotea.
Figure 6. Cytotoxic effects of T14-A24 on (A) L02 cells and (B) HepG2 cells. C: Neuroprotective effect of T14-A24 against H2O2-induced PC12 neurons injury.
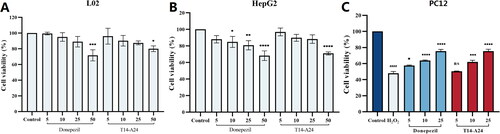
Table 2. Results of the PAMPA-BBB assay for six commercial drugs used in the experimental procedure validation and compounds.
Figure 7. Effects of T14-A24 and donepezil on oligomeric Aβ1–42-induced damage experiments in the MWM task. (A) Protocol followed for in vivo experiments. icv: intraventricular injection; po: orally; MWM: Morris water maze. (B) Daily body weight of mice in different groups during treatment. (C) Learning curves of the escape latencies during the acquisition phase of different groups. (D) Average footprints of mice in MWM on the last day of the study. (E) The time in the target quadrant during the acquisition phase of different groups. (F) The number of times the platform was crossed during the acquisition phase of different groups.
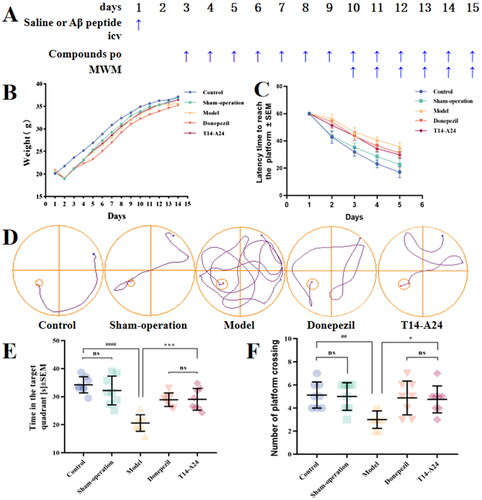
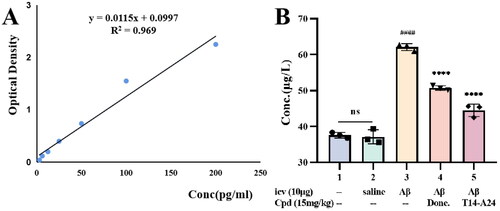
Figure 8. The Aβ1 − 42 total amount was quantified by using a mouse Aβ1 − 42 ELISA kit. (A) Standard curve; (B) Aβ1 − 42 total amount in mice brains of different groups. Calculate brain tissue Aβ1–42 content according to linear regression equation, data are presented as mean ± SEM (n = 8; ####p < 0.0001 (vs. control group), ***p < 0.001, ****p < 0.0001 vs. Aβ1–42 peptide model group).