Figures & data
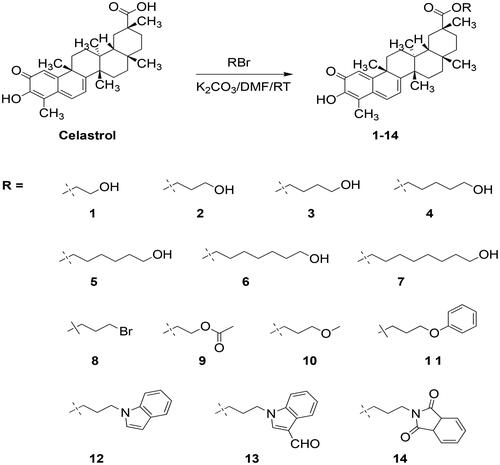
Scheme 1. Synthesis route of Celastrol derivatives 1–14
Scheme 2. Diagram of Structure–activity relationship
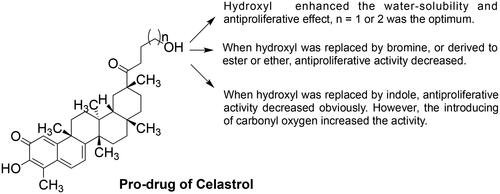
Table 1. The solubility of celastrol and compound 2.
Table 2. Antiproliferative efficacy of celastrol derivatives 1–14 in six human cancer cell lines.
Table 3. In vitro antiproliferative activities of celastrol derivatives 1–14 against normal cell line (LO2) and selectivity index.
Figure 1. Cell cycle arrestation in MGC-803 cells after treatment for 18 h with 0.1% DMSO (vehicle), 2 (0.1 µM, 0.5 µM, 1 µM), and Celastrol(0.1 µM, 0.5 µM, 1 µM), respectively.
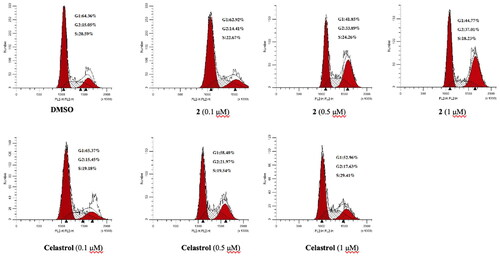
Figure 2. Apoptosis induction in MGC-803 cells after treatment for 18 h with 0.1% DMSO (vehicle), 2(0.1 µM, 0.5 µM, 1 µM), Celastrol (0.1 µM, 0.5 µM, 1 µM), respectively.
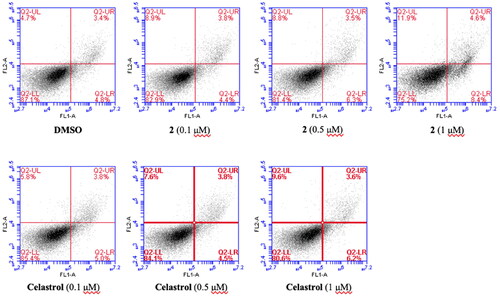
Figure 3. Compound 2 and celastrol inhibited the expression quantity of VEGF in MGC-803 cells. (A) The effects of compound 2, and Celastrol (0.1 µM, 0.5 µM, 1 µM) on the secretion of VEGF in Hypoxia-induced MGC-803. (B) The effects of compound 2, and Celastrol (0.1 µM, 0.5 µM, 1 µM) on the secretion of VEGF in MGC-803. Data are presented as ng.ml−1 and were analysed using one-way ANOVA with Graphpad Prism 7. **p < 0.01, ***p < 0.001 when compared to control group (1%DMSO) (n ≥ 3).
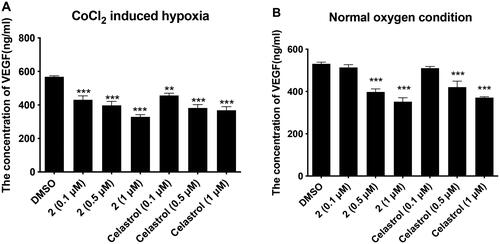
Figure 4. The effects of compound 2 (0.1 µM, 0.5 µM, 1 µM) and celastrol (0.1 µM, 0.5 µM, 1 µM) on the secretion of of MMP-9 in MGC-803. Data are presented as ng ml−1 and were analysed using one-way ANOVA with Graphpad Prism 7. **p < 0.01, ***p < 0.001 when compared to control group (0.1%DMSO) (n ≥ 3).
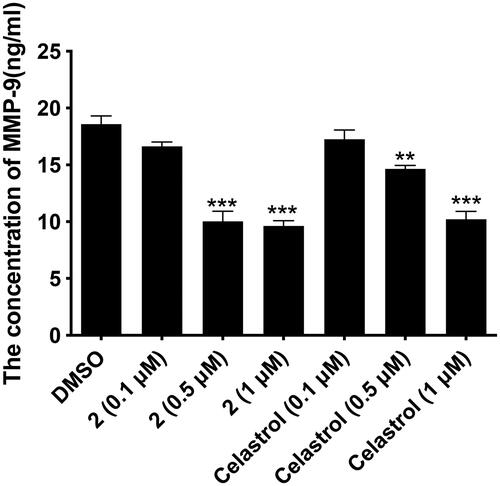
Figure 5. The effects of compound 2 (1 mg/kg, 2.5 mg/kg) and 5-FU (10 mg/kg) on the tumour volume of mice. *p < 0.05, and **p < 0.01 compared with Control group.
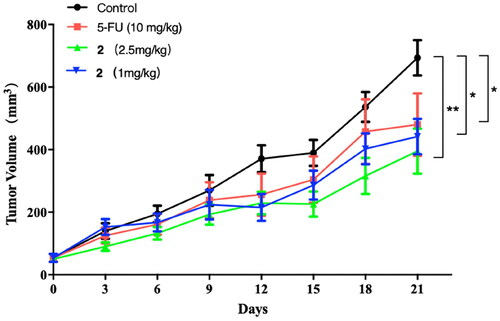
Figure 6. The effects of compound 2 (1 mg/kg, 2.5 mg/kg) and 5-FU (10 mg/kg) on the tumour weight and body weight of mice. (A) Compound 2 and 5-FU inhibited the growth of tumours in mice. ***p < 0.001, and ****p < 0.0001 compared with the control group, ##p < 0.01 when comparing the 5-FU group and high dose group of compound 2; (B) Body weight changes of mice during administration.
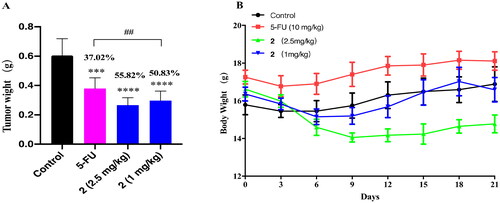
Figure 7. The effects of compound 2 (1 mg/kg, 2.5 mg/kg) and 5-FU (10 mg/kg) on the TNF- α content of tumour mice. *p < 0.05, and **p < 0.01 compared with the control group.
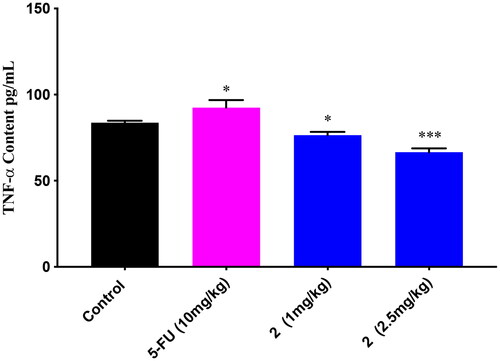
Figure 8. Histological examination of tumour in compound 2 (1 mg/kg, 2.5 mg/kg) and 5-FU (10 mg/kg) treated mice by H&E staining. Original magnification, 400×.
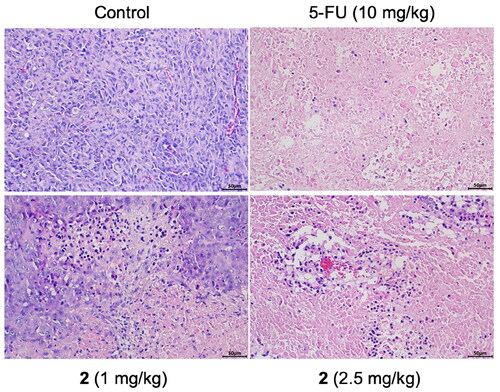
Figure 9. The effects of compound 2 (1 mg/kg, 2.5 mg/kg) and 5-FU (10 mg/kg) on the VEGF expression in tumour mice. (A) Immunohistochemical and dyeing pictures in each group; (B) Quantitative analysis of VEGF expression in each group. Original magnification, 400×.
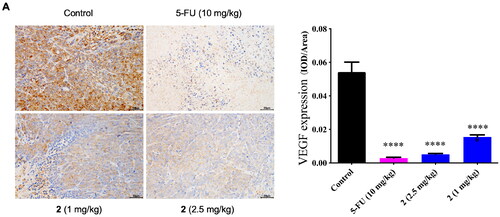
Figure 10. The effects of compound 2 (1 mg/kg, 2.5 mg/kg) and 5-FU (10 mg/kg) on the VEGF expression in Western blotting analysis. Data are represented as the mean ± standard deviation of three independent experiments. *p < 0.05, **p < 0.01when compared to the control.
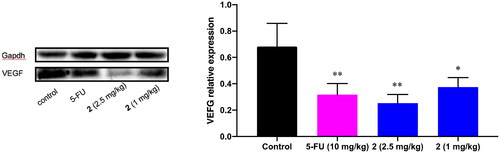
Figure 11. The death rate of zebrafish embryos treated with celastrol (A) and compound 2 (B).
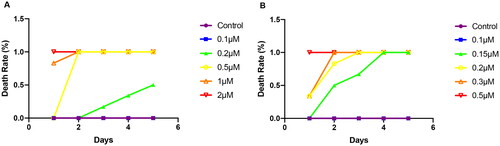
Figure 12. Hatching rate of zebrafish embryos treated with celastrol (A) and compound 2 (B).

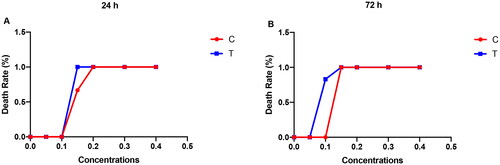
Figure 13. Death rate of adult zebrafish treated with celastrol (abbreviated as C) and compound 2 (abbreviated as T) analysed at 24 and 72 hpf.