Figures & data
Figure 1. Several representative ATAD2 inhibitors. The pink group indicates the classical acetyl group analog unit initiating hydrogen with ASN1064 and the blue groups indicate non-classical ZA loop region binding units.
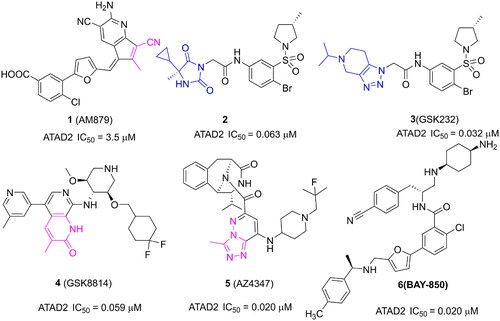
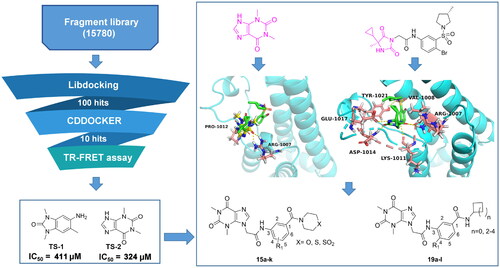
Figure 2. Fragment-Based design of novel ATAD2 inhibitors.
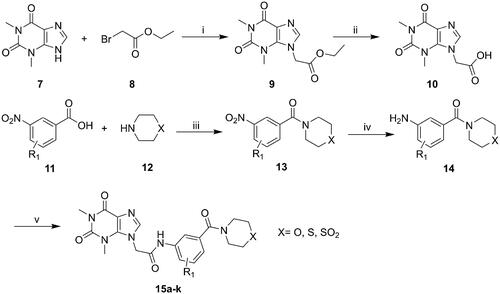
Scheme 1. General synthesis of compounds 15a–k. Reagents and conditions: (i) K2CO3, DMF, 60 °C, 6 h; (ii) methanol, LiOH, r.t., 8 h; (iii) HATU, DIEA, r.t., 24 h; (iv) Fe, NH4Cl, 90 °C refluxed, 3h; (v) HATU, DIEA, r.t., 24 h.
Scheme 2. General synthesis of compounds 19a–i. Reagents and conditions: (i) HATU, DIEA, r.t., 24 h; (ii) Fe, NH4Cl, 90 °C refluxed, 3h; (iii) HATU, DIEA, r.t., 24 h.
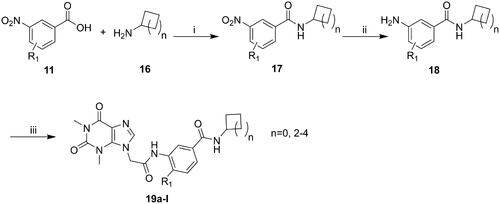
Table 1. The ATAD2 inhibitory activity of compounds 15a–k.
Table 2. the ATAD2 inhibitory activity of compounds 19a–l.
Figure 3. The docking of compound 19f and ATAD2 bromodomain. (A) The structure of compound 19f; (B) The hydrogen interactions of compound 19f and ATAD2 bromodomain in the cartoon; (C) The detailed interactions between compound 19f and ATAD2 bromodomain; (D) The RMSD of ATAD2 atoms around 5 Å of compound 19f; (E) the residues energy decomposition of compound 19f and ATAD2; (F) The effect of AM879, BAY-850 and compound 19f on ATAD2 activity detected by TR-FRET technology; (G) The effect of AM879, BAY-850, and compound 19f on the cell viability of BT-549 cells.
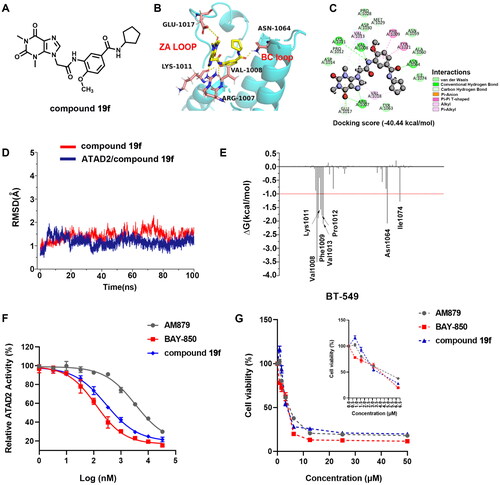
Table 3. The binding free energies were calculated by MM-GBSA method (kcal/mol).
Figure 4. compound 19f inhibits ATAD2-Myc activation in TNBC cells. (A) BT-549 cells were treated with 5, 10, 20 μM compound 19f for 48h, and the expression level of p-c-MycSer62 was detected by immunofluorescence. The nuclei were labelled with DAPI. Scale bar = 100 μm. (B) Relative p-c-MycSer62 intensity was quantified with Image J, and the mean intensity value of the control group was 100%, ****p < 0.0001. (C) BT-549 cells were treated with 10 μM AM879, BAY-850 or compound 19f for 48h, the expression level of p-c-Myc Ser62 was detected by immunofluorescence. The nuclei were labelled with DAPI. Scale bar = 100 μm. (D) Relative p-c-MycSer62 intensity was quantified with Image J, and the mean intensity value of the control group was 100%. ****, p < 0.0001, compared with the control group. ##, p < 0.01, compared with the AM879 treated group. (E,F) BT-549 cells were treated with 5, 10, 20 μM AM879, BAY-850, or compound 19f for 48h, the expression level of ATAD2, c-Myc, and p-c-MycSer62 were detected by western blot. ns, no significance. ***, p < 0.001; ****, p < 0.0001, compared with the control group.
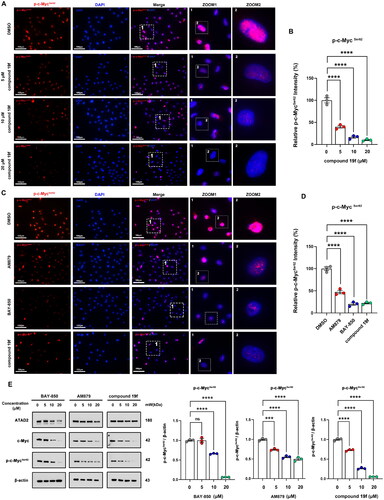
Figure 5. compound 19f inhibits the proliferation of TNBC cells. (A) BT-549 cells were treated with 5, 10, and 20 μM compound 19f for 48h, the newly synthesised DNA was detected using EdU-488, the nuclei were labelled with Hoechst 33258. Scale bar = 200 μm. (B) Relative EdU-488 intensity was quantified with Image J, and the mean intensity value of the control group was 100%. ****, p < 0.0001. (C) Colony formation assays were used to detect the Long-term cell proliferation ability after compound 19f treatment. Relative colony formation ability was quantified with Image J, and the mean value of the control group was 100%. ****p < 0.0001, compared with the control group. (D) 3D spherical plates were used to investigate the effect of compounds on the formation of cell spheres. Relative 3D cell spheres diameter was quantified with Image J, and the mean value of the control group was 100%. ****p < 0.0001, compared with the control group.
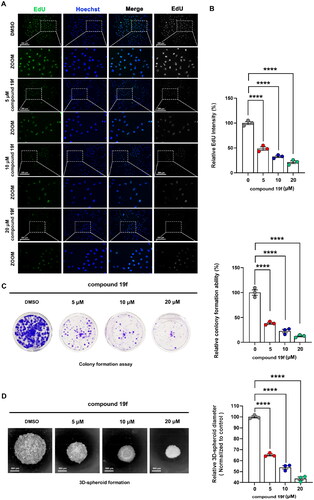
Figure 6. Comparison of the antiproliferative ability of compound 19f, BAY-850 and AM879 on BT-549 cells. (A) BT-549 cells were treated with 10 μM compound 19f, BAY-850 and AM879, the newly synthesised DNA was detected using EdU-488, and the nuclei were labelled with Hoechst 33258. Scale bar = 200 μm. (B) Relative EdU-488 intensity was quantified with Image J, and the mean intensity value of the control group was 100%. ****p < 0.0001, compared with the control group. (C) Colony formation assay were used to detect the long-term cell proliferation ability after compound 19f, BAY-850 and AM879 treatment. Relative colony formation ability was quantified with Image J, and the mean value of the control group was 100%. ****p < 0.0001, compared with the control group. (D) 3D spherical plates were used to investigate the effect of compounds on the formation of cell spheres. Relative 3D cell spheres diameter was quantified with Image J, and the mean value of the control group was 100%. ****p < 0.0001, compared with the control group.
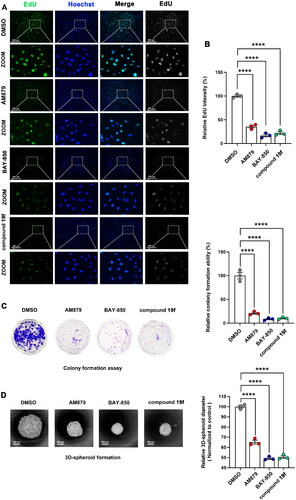
Figure 7. Compound 19f induces apoptosis in BT-549 cells. (A) BT-549 cells were treated with 5, 10, 20 μM compound 19f for 48h, the apoptosis ratio was measured by Annexin V-PI staining. (B) Relative apoptosis ratio was quantified with GraphPad Prism 8. *p < 0.05; **p < 0.01; ****, p < 0.0001, ns, no significance, compared with the control group. (C-D) BT-549 cells were treated with 5, 10, 20 μM compound 19f for 48h, the expression level of Bax, Bcl-2, Caspase-3, Caspase-8, Caspase-9, and PARP were detected by western blot. ns, no significance; *p < 0.05; **p < 0.01; ***p < 0.001; ****p < 0.0001, compared with the control group.
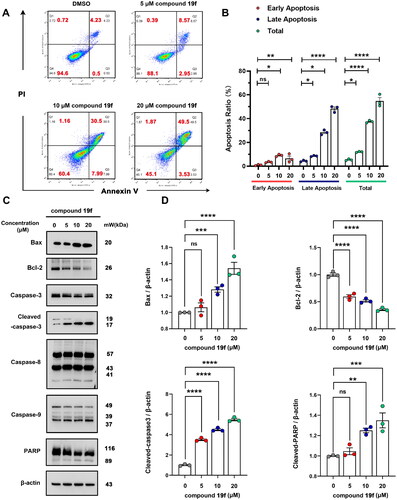
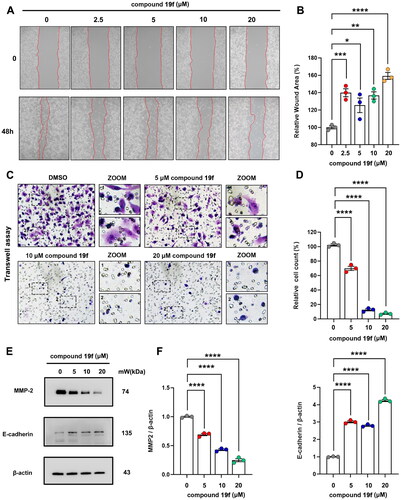
Figure 8. Compound 19f inhibits BT-549 cells migration. (A) Wound healing assay of BT-549 cells treated with 2.5, 5, 10, 20 μM compound 19f for 48h. (B) Relative wound areas were quantified with Image J, and the mean value of the control group was 100%. *p < 0.05; **p < 0.01; ***p < 0.001; ****, p < 0.0001, compared with the control group. (C) Transwell assay of BT-549 cells treated with 5, 10, 20 μM compound 19f for 48h. (D) Relative migrated cell count was quantified with Image J, and the mean value of the control group was 100%. ****p < 0.0001, compared with the control group. (E–F) BT-549 cells were treated with 5, 10, 20 μM compound 19f for 48h, the expression level of MMP-2 and E-cadherin were detected by western blot. ****p < 0.0001, compared with the control group.