
Figures & data
Scheme 1. Design strategy and synthetic route for honokiol derivatives. (i) Fluorobenzylchloride, DMF, Na2CO3, 70–75 °C, 3–6 h. (ii) 25%NaOH, TBAB, CHCl3, 65 °C, 2–3 h. (ii) Acetic acid, aminoguanidine carbonate, 65 °C, 3–4 h.

Table 1. Anti-proliferative activities of compounds (72 h, IC50, μM).
Table 2. Cytotoxic activity of 1g on TM cells for 72 h (IC50, μM).
Figure 1. Inhibitory effect of 1g on cell viability in CNE-2Z cells. (a) Cytotoxic activity of 1g was measured using MTT assay. (b) Effects of 1g on the ability of cells to form colonies in CNE-2Z cells using colony-formation assay. (c) Quantification of the colony-formation assay. *P < 0.05 compared with the control.

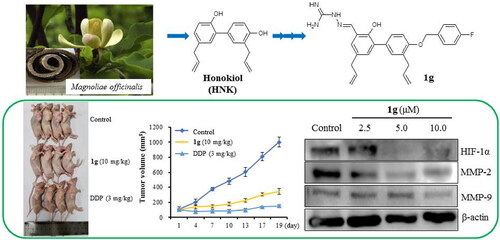
Figure 2. Effects of compound 1g on the migration and invasion of CNE-2Z cells by a transwell assays. (a) CNE-2Z cells were seeded into a transwell chamber and exposed to 1g (1.0, 3.0, and 6.0 μM) for 24 h to evaluate the migration and invasion activities. (b) Quantification analysis presented as the mean ± standard deviation. (c) Western blotting analyses of HIF-1α, MMP-2, and MMP-9 protein levels in CNE-2Z cells treated with various concentrations (2.5, 5.0, and 10.0 μM) of 1g. β-Actin was used as an internal control. *P < 0.05, **P < 0.01compared with the control.

Figure 3. Knock-down of HIF-1α with siRNA protected against 1g inhibited migration and invasion in CNE-2Z cells. (a) The cells were transfected with HIF-1α siRNA, and whole cell lysates were subjected to western blotting analysis. (b) Transwell assay was used to detect cell migration and invasion after 24 h transfection with HIF-1α siRNA (original magnification 200×).

Figure 4. Compound 1g induced cell death in human nasopharyngeal carcinoma CNE-2Z cells. (a) Flow cytometric analysis of cell death after treatment with various concentrations (2.5, 5.0, and 10.0 μM) of 1g using annexin V-FITC/PI dual staining. (b) Western blotting analysis of Bax, Bcl-2, and Akt protein levels.

Figure 5. Anti-tumour efficacy of 1g in CNE-2Z cell xenograft in nude mice (n = 4). (a) Representative tumours from each treatment group. (b) Tumour volume of each treatment group. (c) Body weight changes of nude mice. (d) The GPT and GOT of blood serum samples were determined by assay kit and the GPT and GOT activities are expressed as U/L. (e) H&E stained sections of the liver, kidney, lung, and tumour from the mice after treated with saline, DDP (3 mg/kg) and 1g (10 mg/kg).
