Figures & data
Figure 1. Structures of the triazole antifungal agents and novel triazole compounds.
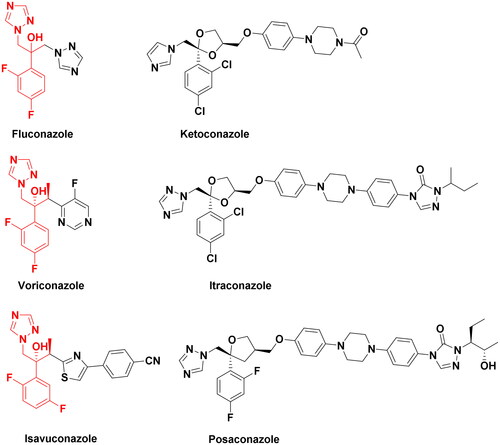
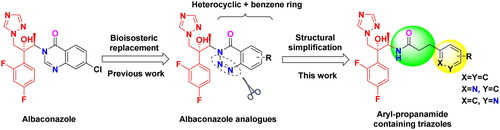
Figure 2. Design strategy of target compounds.
Scheme 1. Synthesis of the target compounds. (a) (i) Et3N, MsCl, DCM, 0 °C, 1 h; (ii) NaOH, H2O, 0 °C, 4 h; (b) NH4Cl, NaN3, DMF, 80 °C, 10 h; (c) Pd/C, H2, MeOH, r.t., 8 h; (d) Substituted propionic acid, PyBOP, DIEA, DMF, r.t., 5 h.
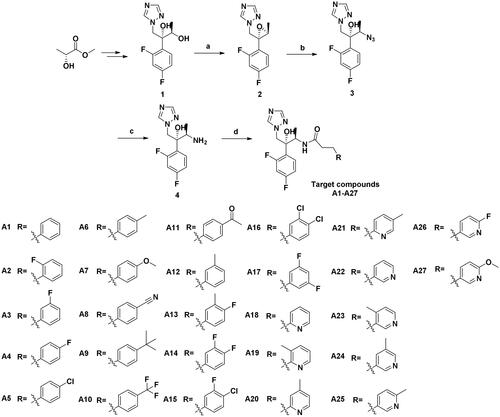
Figure 3. The single-crystal structure of amine 4.
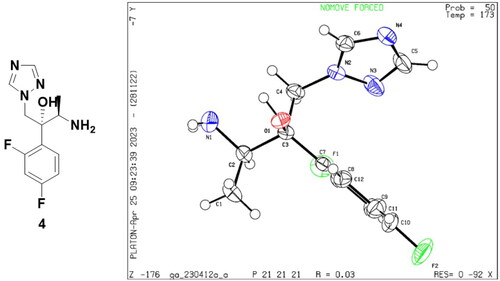
Table 1. In vitro antifungal activity of the target compounds against tested fungi (MIC, μg/mL).
Table 2. In vitro antifungal activity of the potent compounds against FCZ-resistant C. albicans and C. auris isolates measured by MIC (μg/mL).
Figure 4. GC-MS analysis of sterols in C. albicans cells. The fungal strain was treated with DMSO (Control), FCZ, compounds A1, A3 or A9 at 8 μg/mL for 8 h.
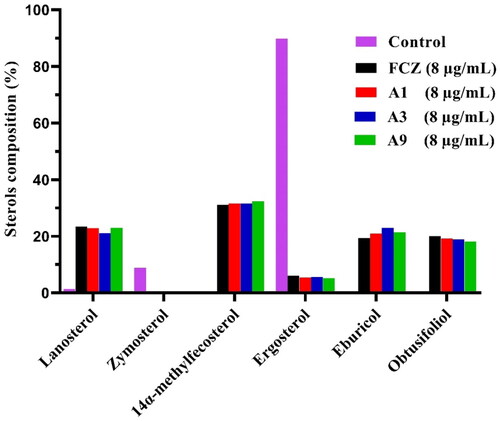
Figure 5. Haemolytic effect of A1, A3 and A9 against rabbit red blood cells at different indicated concentrations.
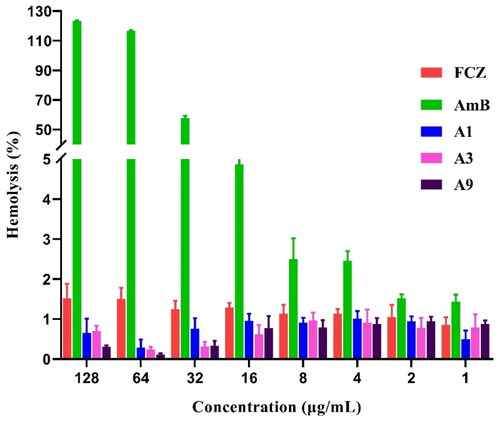
Figure 6. Predicted binding mode of compounds A3 and A9 (blue) in the active site of CYP51. Yellow dashed lines represent the halogen bond interactions and magenta dashed lines represent the coordination bond. The image was generated using PyMol.
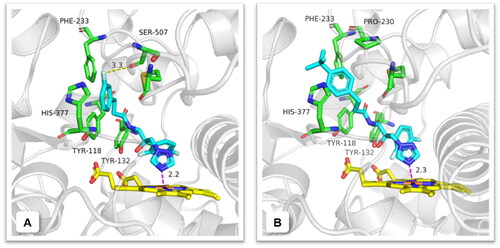
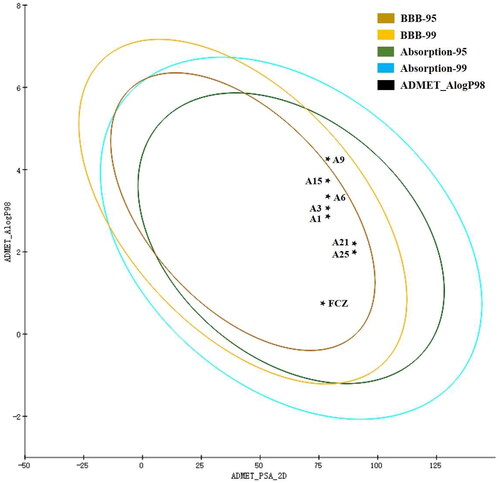
Figure 7. The evaluation egg-chart of PSA and Alog P of tested compounds. The 95% and 99% confidence limit ellipses of blood-brain barrier and intestinal absorption models.