Figures & data
Figure 1. Membrane expression of CA12 was reduced by histamine treatment in lung cancer cells. Protein expression levels of CA12 after histamine (His) treatment (100 μM, 24 h and 48 h) in both (A) Beas-2B (left panels) and (B) A549 (right panels) cells. β-actin was used as a loading control. (C) The graph indicates relative intensity of CA12, normalised by β-actin. The bars represent means ± SEM (n = 4, *p < 0.05, ***p < 0.001). β-actin was used as a loading control. (D) Immunofluorescence staining of CA12 (green) and DAPI (blue) after His treatment (100 μM, 24 h) in Beas-2B and A549 cells. The scale bar represents 50 μm. (E) High magnification of immunofluorescence staining of CA12 (green) and DAPI (blue) after His treatment (100 μM, 24 h) in A549 cells. The scale bar represents 10 μm. (F) Immunofluorescence staining of CA12 (green) and DAPI (blue) after His treatment (100 μM, 24 h) in CA12-overexpressed H1299 cells. The scale bar represents 10 μm. (G) Surface expression of CA12 after His (100 μM, 24 h) treatment in A549. (H) The graph indicates relative intensity of CA12, normalised by input CA12 and β-actin. The bars represent means ± SEM (n = 3). β-actin was used as a loading control. (I) pHRodo staining (green) after His treatment (100 μM, 24 h) in Beas-2B and A549 cells. The scale bar represents 50 μm. (J) The graph indicates the relative intensity of pHRodo. The bars present means ± SEM (n = 18, ***p < 0.001).
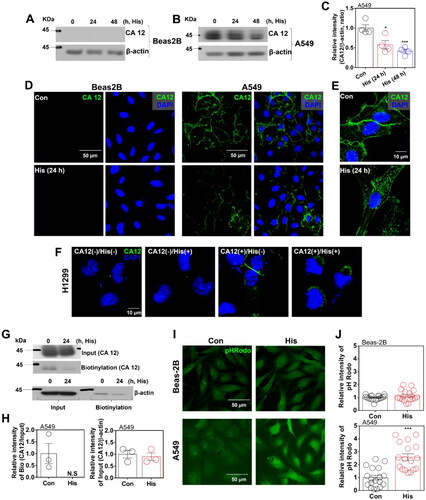
Figure 2. Histamine treatment reduced NBC activity in A549 cells. (A) NBC activity in response to histamine (His) treatment (100 μM) for 24 h in Beas-2B (left panel) and A549 (right panel) cells. (B) The graphs indicate NBC activities of Beas-2B (left panel) and A549(right panel) cells in response to His treatment (100 μM). The bars represent means ± SEM (n = 5 ∼ 6, **p < 0.01). (C, D) Immunofluorescence staining of NBCn1 (red) and DAPI (blue) after His treatment (100 μM, 24 h) in Beas-2B (C) and A549 (D) cells. The scale bar represents 10 μm. (E) The graph indicates the relative intensity of NBCn1 after His treatment (100 μM, 24 h) in Beas-2B cells. The bars represent means ± SEM (n = 8 ∼ 9). (F) The graph indicates relative intensity of NBCn1 after His treatment (100 μM, 24 h) in A549 cells. The bars represent means ± SEM (n = 10 ∼ 13, ***p < 0.001). (G) Immunofluorescence staining of CA12 (green) and NBCn1 (red) after His treatment (100 μM, 24 h) in A549 cells. DAPI (nucleus, blue). (H ∼ K) The graph indicates relative intensity of CA12-membrane fraction (H), CA12-cytosolic fraction (I), NBCn1-membrane fraction (J), and NBCn1-cytosolic fraction (K) after His treatment (100 μM, 24 h) in A549 cells. The bars represent means ± SEM (n = 6 ∼ 14, *p < 0.05, **p < 0.01).
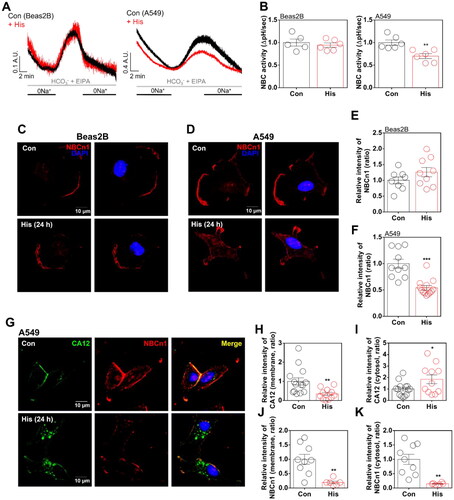
Figure 3. Histamine treatment enhanced CBE activity with the involvement of intracellular calcium increase. (A) CBE activity in response to histamine (His) treatment (100 μM) for 24 h in Beas-2B cells. (B) The graph indicates CBE activity in response to His treatment (100 μM). The bars represent means ± SEM (n = 5 ∼ 6, **p < 0.01). (C) CBE activity in response to His treatment (100 μM) for 24 h in A549 cells. (D) The graph indicates CBE activity in response to His treatment (100 μM). The bars represent means ± SEM (n = 8, ***p < 0.001). (E) The graphs indicate the CBE activities of Beas-2B and A549 cells in control. The bars represent means ± SEM (n = 5 ∼ 8, *p < 0.05). (F) CBE activity in response to His treatment (100 μM) with and without BAPTA-AM (BAPTA; 10 μM) for 24 h in A549 cells. (G) The graph indicates CBE activity in response to His treatment (100 μM) with and without BAPTA-AM (10 μM) for 24 h in A549 cells. The bars represent means ± SEM (n = 3 ∼ 4, ***p < 0.001 vs Control and ###p < 0.001 vs His-treated group).
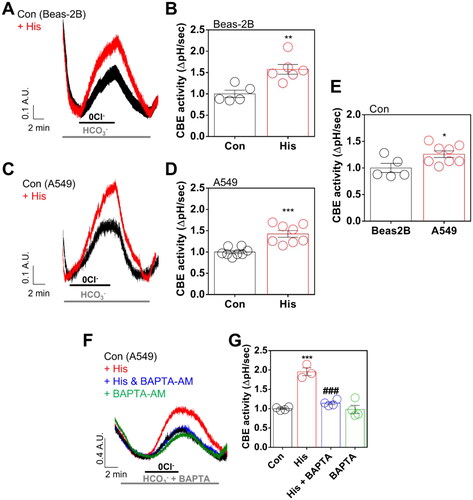
Figure 4. Histamine mediated CA12 and AE2 trafficking through the involvement of calcium-dependent calmodulin kinase II. (A) Immunofluorescence staining of CA12 (green) and AE2 (red) after histamine (His) treatment (100 μM, 24 h) in A549 cells. DAPI (nucleus, blue). (B) CBE activity in response to His treatment (100 μM) with and without KN62 (10 μM) for 24 h in A549 cells. (C) The graph indicates CBE activity in response to His treatment (100 μM) with and without KN62 (10 μM) for 24 h in A549 cells. The bars represent means ± SEM (n = 4 ∼ 5, *p < 0.05 vs Control and #p < 0.05 vs His-treated group). (D) Surface expression of AE2 and CA12 after His (100 μM) with and without KN62 (10 μM) for 24 h in A549 cells. (E) The graph indicates the relative intensity of AE2 normalised by input AE2 and β-actin. The bars represent means ± SEM (n = 5, *p < 0.05 vs Control and #p < 0.05 vs His-treated group). β-actin was used as a loading control. (F) The graph indicates the relative intensity of CA12 normalised by input CA12 and β-actin. The bars represent means ± SEM (n = 6, *p < 0.05 vs Control). β-actin was used as a loading control. (G) pHRodo staining (green) after His treatment (100 μM) with and without KN62 (10 μM) for 24 h in A549 cells. The scale bar represents 50 μm. (H) The graph indicates the relative intensity of pHRodo. The bars present means ± SEM (n = 4 ∼ 6, ***p < 0.001 vs Control and #p < 0.05 vs His-treated group).
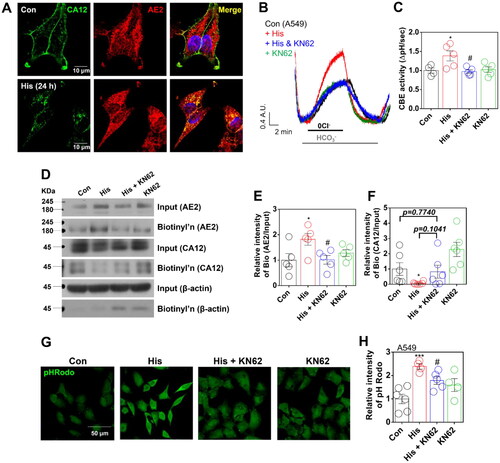
Figure 5. Cellular pH was modulated by CA12 and AE2 trafficking. (A) Surface expression of CA12 and AE2 after histamine (His) (100 μM) with and without bafilomycin (Baf; 2 μM) for 24 h in A549 cells. (B) The graph indicates the relative intensity of AE2 normalised by input AE2 and β-actin. The bars represent means ± SEM (n = 6, *p < 0.05 vs Control and #p < 0.05 vs His-treated group. (C) The graph indicates the relative intensity of CA12 normalised by input CA12 and β-actin. The bars represent means ± SEM (n = 6, *p < 0.05 or **p < 0.01 vs Control and #p < 0.05 vs His-treated group). β-actin was used as a loading control. (D) Immunofluorescence staining of CA12 (red) and DAPI (blue) after His treatment (100 μM) with and without Baf (2 μM) for 24 h in A549 cells. (E) Immunofluorescence staining of AE2 (green) and DAPI (blue) after His treatment (100 μM) with and without Baf (2 μM) for 24 h in A549 cells. (F) CBE activity in response to His treatment (100 μM) with or without Baf (2 μM) for 24 h in A549 cells. (G) The graph indicates CBE activity in response to His treatment (100 μM) with and without Baf (2 μM) for 24 h in A549 cells. The bars represent the mean ± SEM (n = 3 ∼ 5, **p < 0.01). (H) pHRodo staining (green) after His treatment (100 μM) with and without Baf (2 μM) for 24 h in A549 cells. The scale bar represents 50 μm. (I) The graph indicates the relative intensity of pHRodo. The bars present means ± SEM (n = 4 ∼ 5, *p < 0.05 vs Control and ##p < 0.01 vs His-treated group).
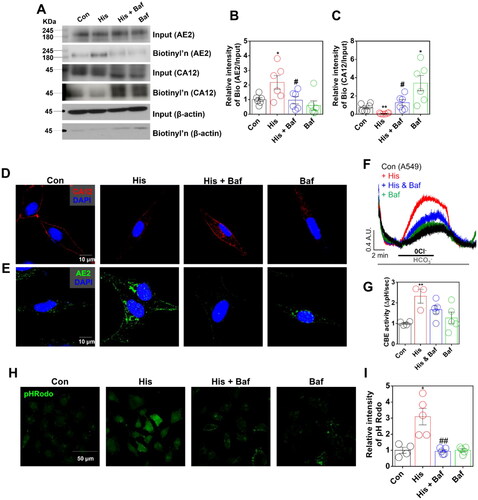
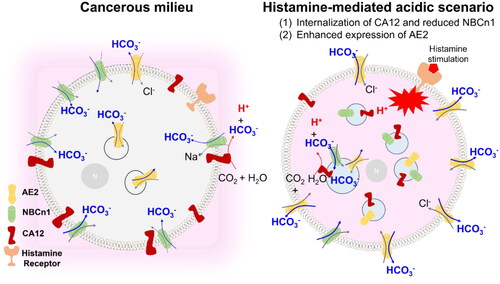
Figure 6. Schematic illustration of cellular pH regulation through the histamine-mediated acidic scenario. NBCn1 and its associated CA12 co-localize at the plasma membrane. Histamine stimulation induces convergent trafficking of pH-associated proteins such as internalised CA12 and reduced NBCn1 and enhanced expression of AE2 in lung cancer cells. Internalised CA12 and reduced NBCn1 exhausted cytosolic bicarbonate and the enhanced AE2 exacerbates bicarbonate efflux. This histamine receptor activation-induced phenomenon mediated acidic cytosol as termed acidic scenario.