
Figures & data
Figure 1. The ubiquitin-proteasome system is the basis for PROTACs’ mechanism (created in BioRender.com). Ubiquitination catalyzed by E1, E2, and E3 enzymes and deubiquitination by deubiquitination enzymes (DUBs). The proteasome breaks down the proteins that have been tagged with ubiquitin by specific enzymes (A); a POI ligand, an E3 ligand, and a linker are present in PROTAC. Inducing polyubiquitination and proteasome-mediated degradation of POIs is the function of the E3-PROTAC-POI ternary complex (B); chemical structures of immunomodulatory drugs approved by FDA (C) immunomodulatory drugs bind CRBN, a part of CUL4-RBX1-DDB1-CRBN complex (D).
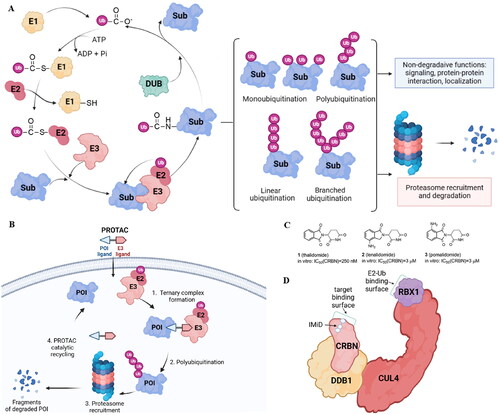
Figure 2. Protein lysine acetylation and deacetylation catalyzed by lysine acetyltransferases (KATs) and lysine deacetylases (KDACs) with Ac-CoA as the acetyl group donor (A); current HDAC inhibitors approved by FDA and China’s National Medical Products Administration (B).
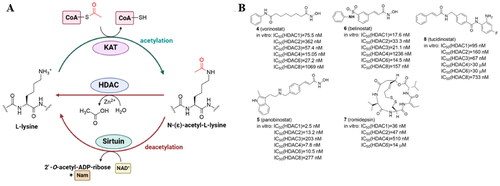
Table 1. Categorisation of KAT and KDAC enzymes.
Figure 3. Structures and activities of PROTACs targeting KATs.
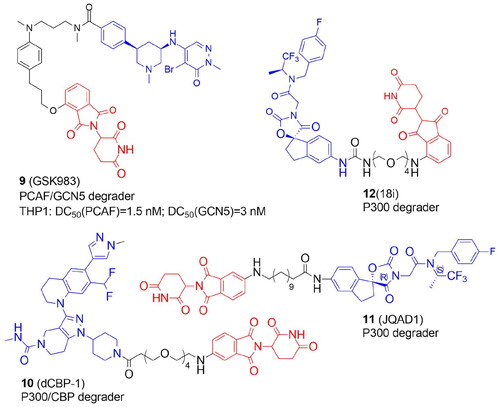
Table 2. Components and structural details of KAT-PROTACs.
Table 3. Experimental methods and cell models applied in development of KAT-PROTACs.
Table 4. Components and structural details of KDAC-PROTACs.
Table 5. Experimental methods and cell models applied in development of KDAC-PROTACs.
Figure 4. Structures and activities of PROTACs targeting SIRT2.
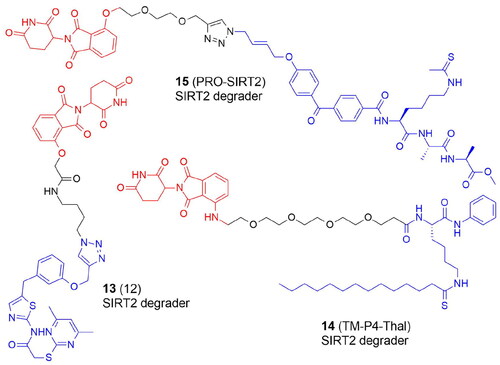
Figure 5. Structures and activities of PROTACs targeting HDAC1, HDAC2, and HDAC3.
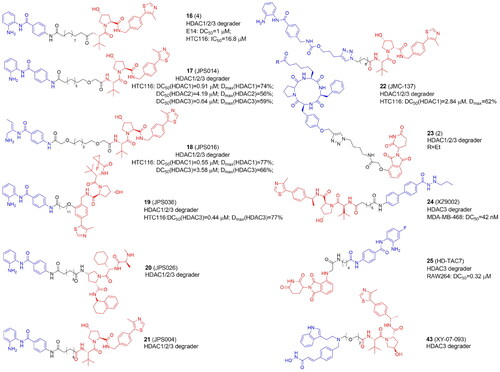
Figure 6. Structures and activities of PROTACs targeting HDAC4, HDAC6, and HDAC8.
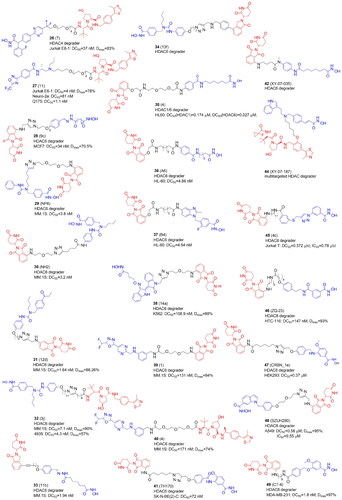
Table 6. Categorisation of human KMTs, PRMTs, and NTMTs.
Figure 7. Protein lysine methylation catalyzed by lysine methyltransferases (KMTs) (A); protein arginine methylation catalyzed by protein arginine methyltransferases (PRMTs) (B); N-terminus methylation catalyzed by N-terminal methyltransferases (NTMTs) with S-adenosyl methionine (SAM) as the methyl group donor (C); tazemetostat – KMT inhibitor approved by FDA (D).
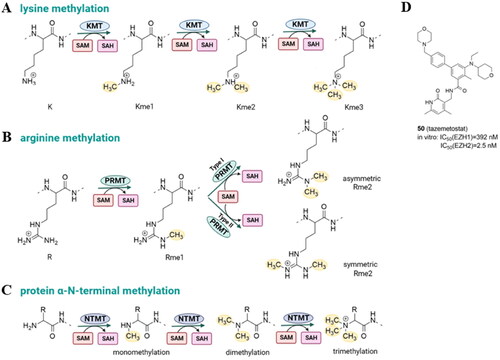
Figure 8. Structures and activities of PROTACs targeting protein methyltransferases.
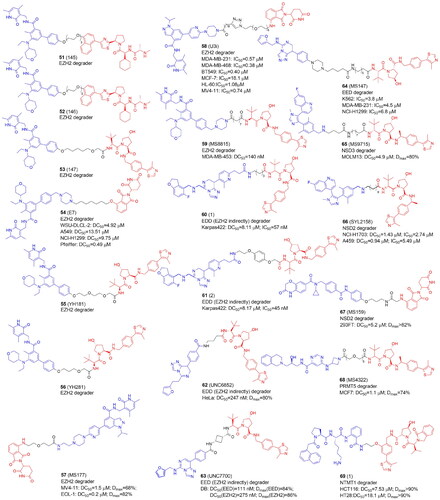
Table 7. Components and structural details of PROTACs targeting protein methyltransferases.
Table 8. Experimental methods and cell models applied in development of PROTACs targeting protein methyltransferases.
Figure 9. Protein ADP-ribosylation catalyzed by ADP-ribosyltransferases (ARTs) with enzymatic activity of mono- and poly-ADP-ribosylation (MARylation and PARylation, respectively) (A) (created in BioRender.com). Structure of four PARP inhibitors approved by FDA (B).
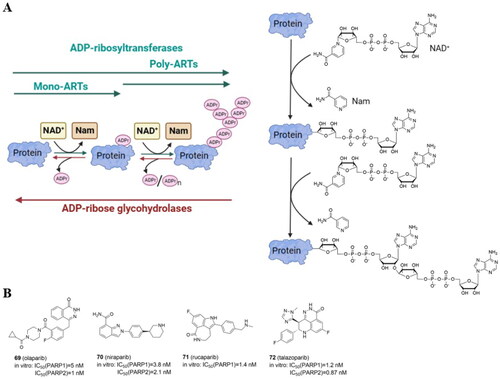
Table 9. Categorisation of ADP-ribosyltransferases (ARTs).
Figure 10. Structures and activities of PROTACs targeting ADP-ribosyltransferases.
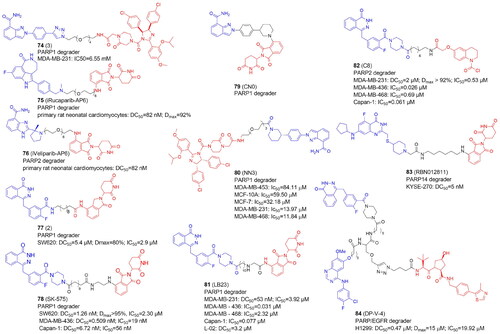
Table 10. Components and structural details of ART-PROTACs.
Table 11. Experimental methods and cell models applied in development of PROTACs targeting ADP-ribosyltransferases.
Table 12. Categorisation of E3 ligases with the selected members of each family.
Figure 11. Structures and activities of PROTACs targeting E3 Ligases.
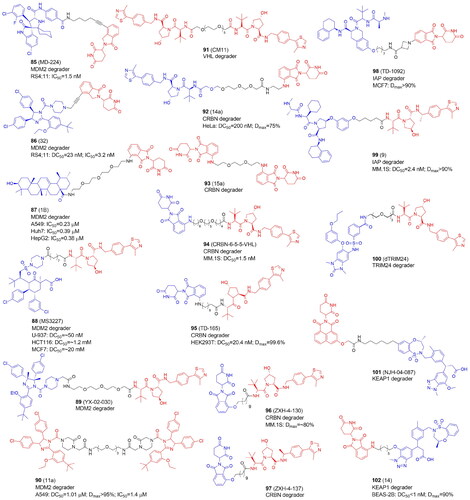
Table 13. Components and structural details of E3 Ligases-targeting PROTACs.
Table 14. Experimental methods and cell models applied in development of E3 Ligases-targeting PROTACs.
Table 15. Categorisation of deubiquitination enzymes.
Figure 12. Structures and activities of PROTACs targeting deubiquitination enzymes.
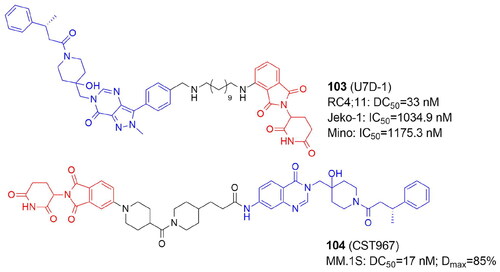
Table 16. Components and structural details of DUBs-targeting PROTACs.
Table 17. Experimental methods and cell models applied in development of DUBs-targeting PROTACs.
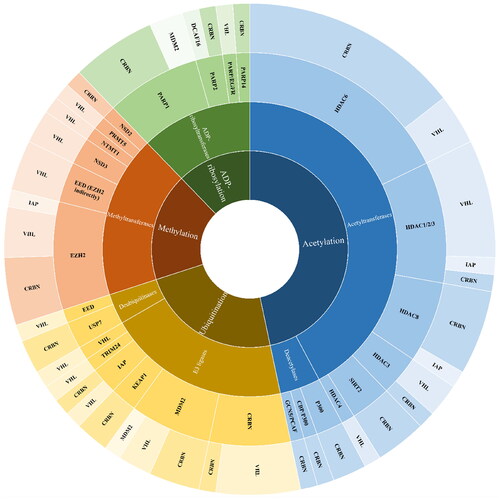
Figure 13. The pie chart summarising the privileged E3 ligase ligands depending on the class of POIs. The chart was prepared according to the number of the most active PROTACs listed in Tables presenting components and structural details of PROTACs.
Data availability statement
Data sharing is not applicable to this article as no new data were created or analysed in this study.