Figures & data
Table 1. Human sEH inhibition data and some physicochemical characteristics of t-AUCB analogs 9 and 10.
Table 2. Human sEH inhibition data and some physicochemical characteristics of compounds 11a–i, 12a–g, 12i.
Figure 1. (A) Final view of the complex of 10 with sEH (PDB ID: 5AM3) predicted by molecular dynamics (in pink) and predicted by molecular docking (in light blue). Molecule of t-AUCB (1a) is shown in beige for comparison. The inhibitors are represented by the ball-and-stick model, selected amino acid residues are represented by coloured sticks, hydrogen atoms are omitted for clarity. Protein secondary structure is shown by ribbons. (B) A two-dimensional diagram of the interactions of compound 10 with sEH (Cl – π interaction is shown specially by a solid blue line).
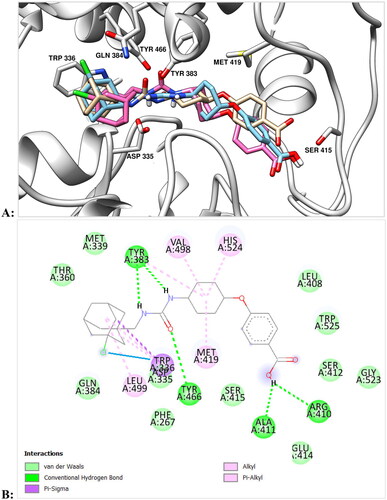
Figure 2. (А) Positions of compounds 11d (in green) and 11e (in salmon) with sEH predicted by molecular docking (in light blue). Molecule of t-AUCB (1a) is shown in beige for comparison. The inhibitors are represented by the ball-and-stick model, selected amino acid residues are represented by coloured sticks, hydrogen atoms are omitted for clarity. Protein secondary structure is shown by ribbons. (B,C) Two-dimensional diagrams of the interactions of compounds 11d (B) and 11e (C) with sEH. More essential interactions with residues of the active site for the second compound are clearly visible.
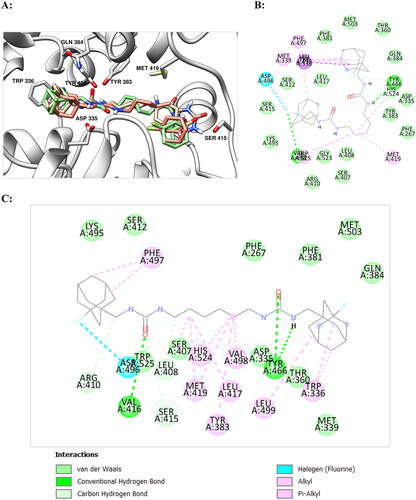
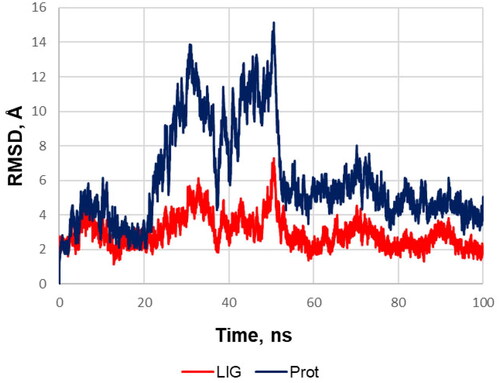
Figure 3. RMSD of the heavy protein atoms during the molecular dynamics simulation of the compound 12 (red) and protein (blue). The plot and the visual analysis of the trajectory indicates that during the simulation of molecular dynamics one monomeric subunit of sEH sharply deviates at the twentieth second and then returns to its original position; while the ligand shifts slightly to a more favourable position in the binding site and from about the fiftieth second the system stability is retained over the course of the production simulation.