Figures & data
Table 1. Evaluation of antioxidant activity, total phenolic and flavonoid content of P. casabonae leaves extract.
Figure 1. Fatty acid (FA) chromatographic profiles (HPLC analysis) obtained by DAD (200 nm, unsaturated FA) and ELSD (saturated FA) detection (A) and FA composition (expressed as mg/g of extract) determined by HPLC-DAD/ELSD analysis (B) of P. casabonae leaf extract after saponification. Analysis was performed in quadruplicate and all data are expressed as mean values ± standard deviations (SD) (n = 4).
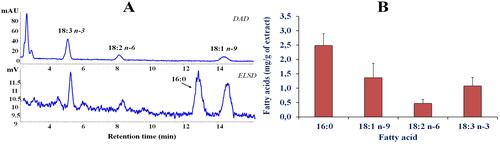
Table 2. Inhibitory activity of P. casabonae extract against α-glucosidase and α-amylase.
Figure 2. Inhibition of α-glucosidase activity. Lineweaver–Burk analysis (A) and secondary plot (B) using different concentrations of the extract.
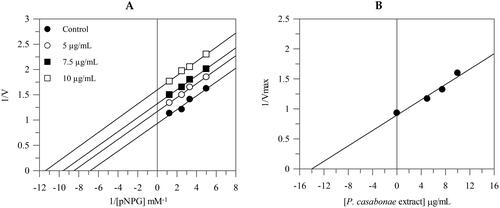
Figure 3. Effect of P. casabonae extract on Caco-2 cell viability after 24 h incubation with the extract at different concentrations. No statistically differences between treated and non-treated (NT) cells were observed.
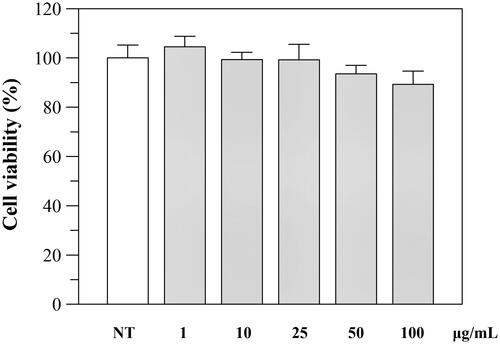
Figure 4. Inhibition of H2O2-induced ROS generation (1 h-incubation with 2 mM H2O2) by P. casabonae extract on Caco-2 cells. NT, non-treated cells; T, cells treated with H2O2 only. Asterisks indicate values statistically different (*p < 0.05; ** p < 0.0001) from cells treated with H2O2 only (T). All H2O2-treated samples were statistically different from NT with the exceptions of 100 μg/mL P. casabonae extract.
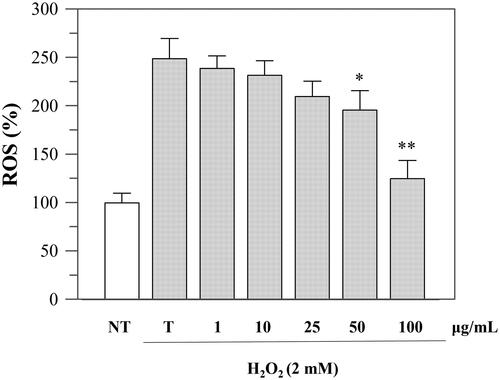
Figure 5. Chromatographic profile of P. casabonae leaves extract (λ = 330 nm). Compound numbers refer to .
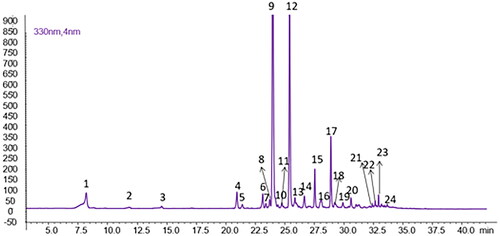
Table 3. List of identified and tentatively identified compounds in P. casabonae leaves extract.
Figure 6. Chromatographic profile of the succinyl-dicaffeoylquinic enriched fraction (λ = 330 nm).
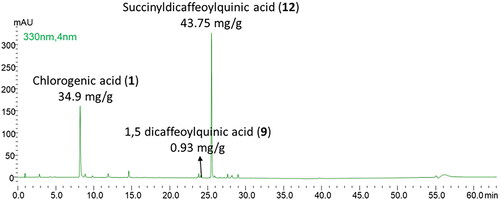
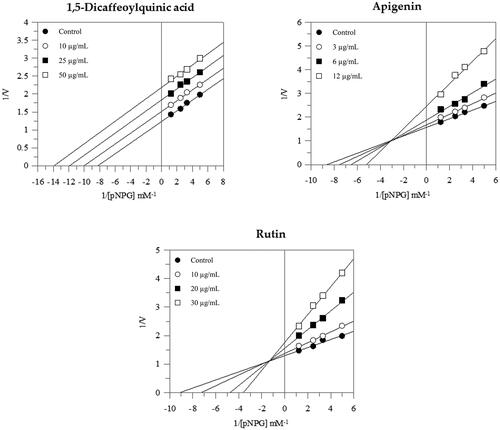
Table 4. IC50 value (μg/mL) and inhibition type of P. casabonae fraction and single compounds.
Figure 7. Inhibition of α-glucosidase activity by single compounds. Lineweaver-Burk plot for inhibition of α-glucosidase at different compounds concentrations.