
Figures & data
Figure 1. Representative examples of FDA-approved VEGFR inhibitors.
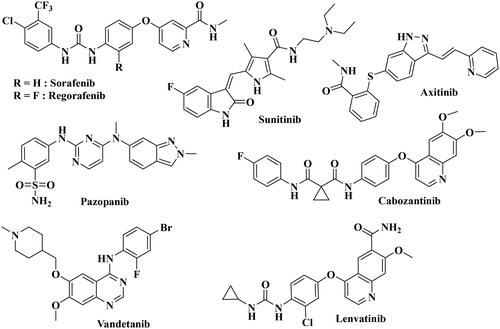
Figure 2. Examples of reported chalcone VEGFR inhibitors.
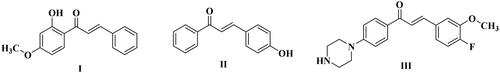
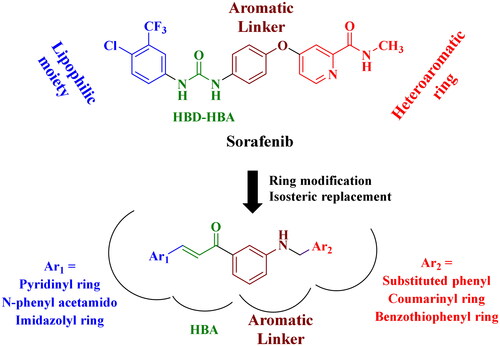
Figure 3. New synthesised compound rational design.
Scheme 1. Synthesis of target derivatives 5a–5n
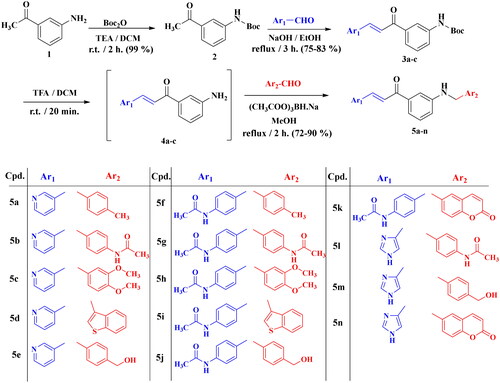
Figure 4. Cell line sensitivity to compounds 5a–5n. The average of growth inhibition (GI) obtained with all compounds of the series was calculated for each cell line of the panel. Red bars correspond to an average of GI greater than 100%.
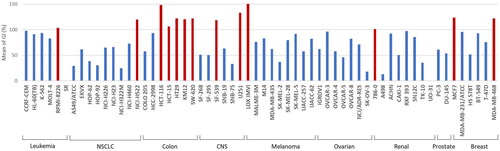
Table 1. Anticancer effects of compounds 5a–5n versus NCI-60 cancer cell lines presented as percent growth inhibition.
Table 2. In vitro anticancer activity presented as GI50 (μM) of selected active compounds (5a–5j) and Sorafenib (NSC: 800934) versus different cell lines.
Figure 5. The dose response curves of NCI full panel for compound 5h (the graphs of the remaining compounds are presented in the supplementary data).
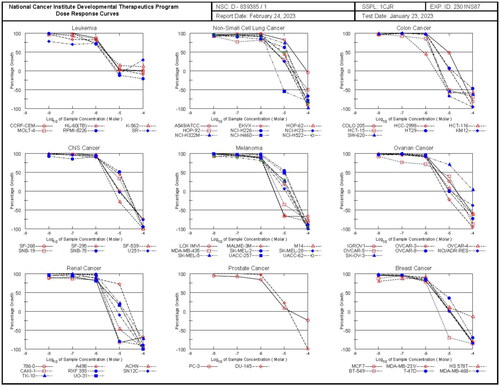
Table 3. Median growth inhibitory concentrations (MG-MID-GI50, μM) and selectivity index of in vitro subpanel tumour cell lines for compounds 5b, 5d, 5e, and 5h and sorafenib (NSC: 800934).
Figure 6. Structure–activity relationship for compounds 5a–5n.
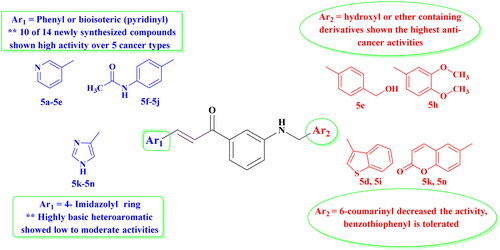
Table 4. In vitro assessment of VEGFR inhibitory activity of derivatives 5a–5j as measured IC50 compared to Sorafenib as positive standard.
Figure 7. Contour plots measuring the percentage of viable (LL), early apoptotic (LR), late apoptotic (UL), and necrotic cells (UR) by AV/PI assay using flow cytometry. The assay was performed after the treatment of HCT-116 (colon cancer) for 24h with doxorubicin, 5e and 5h compared to 0.1% DMSO negative control.
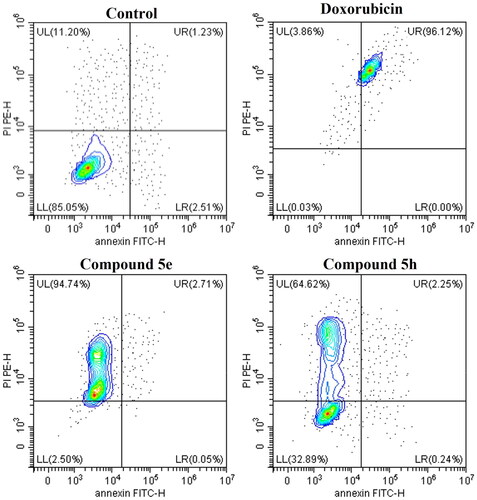
Table 5. Apoptosis assay measuring the percentage of viable, apoptotic, late apoptotic, and necrotic cells by AV/PI assay using flow cytometry. The assay was performed after the treatment of HCT-116 (colon cancer) for 24 h with doxorubicin (positive control), 5e and 5h compared to 0.1% DMSO negative control. Data represented as mean ± standard error of the mean (SEM), n = 3.
Figure 8. Histograms for cell cycle analysis measuring the percentage of SubG0-G1, G0-G1, S-, and G2M phases by PI assay using flow cytometry. The assay was performed after the treatment of both HCT-116 (colon cancer) for 24h with doxorubicin, 5e and 5h compared to 0.1% DMSO negative control. Data represented as mean ± standard error of the mean (SEM), n = 3.
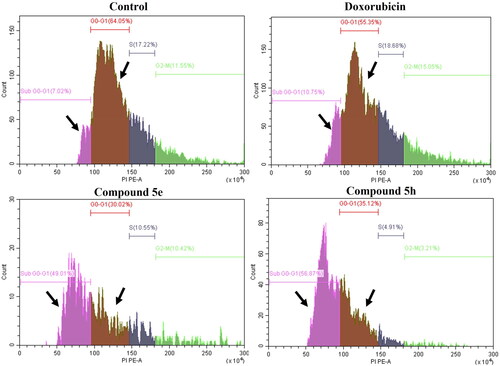
Table 6. Cell cycle analysis of HCT-116 (colon cancer) treated for 24 h with doxorubicin (positive control), 5e and 5h compared to 0.1% DMSO negative control showing the DNA content at different cycle phases.
Table 7. Gene expression fold change in HCT-116 (colon cancer) treated for 24h with doxorubicin (positive control), 5e and 5h compared to 0.1% DMSO negative control showing the expression fold change in n = 3 using 2-ΔΔct method.
Figure 9. Measurement of caspase-3 (Casp-3) and Bax protein levels after treatment of compounds 5e and 5h in HCT-116 cancer cells compared to 0.1% DMSO (negative control). The cells were treated with the IC50 concentrations of compounds for 24h and data were shown as mean ± SEM of three independent experiments (n = 3).
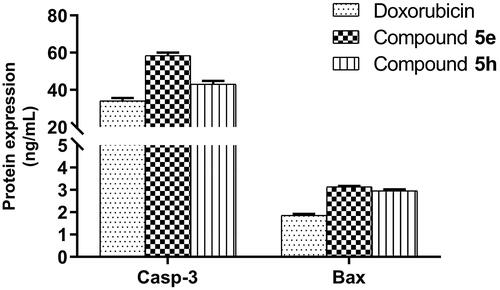
Figure 10. Docking interaction (2D) with the VEGFR-2 enzyme for (A) Sorafenib, (B) 5e, and (C) 5h.
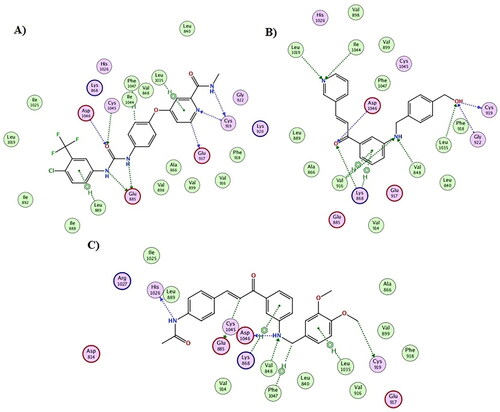
Figure 11. Docking interaction (3D form) for compounds (A) 5e and (B) 5h.
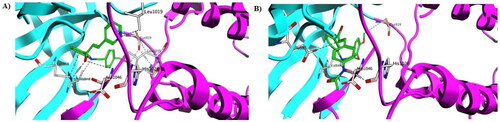
Figure 12. Molecular dynamic simulation of two stable complexes of 5h-VEGFR-2 and Sorafenib-VEGFR-2; (A) RMSD analysis for the MD simulations of 5h–VEGFR-2 and sorafenib–VEGFR-2, in addition to the Apo form of VEGFR-2, (B) RMSF analysis for the MD simulations of 5h–VEGFR-2 and Sorafenib–VEGFR-2, in addition to the Apo form of VEGFR-2.
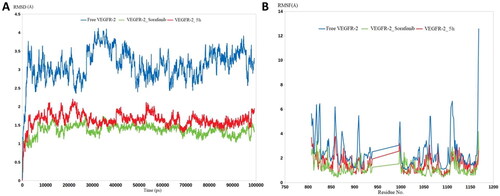
Table 8. Primer’s sequence of apoptotic genes used for gene expression analysis.