Figures & data
Figure 1. Schematic diagram of the AAK1 kinase domain and domain organisation comparison of the human NAK family.
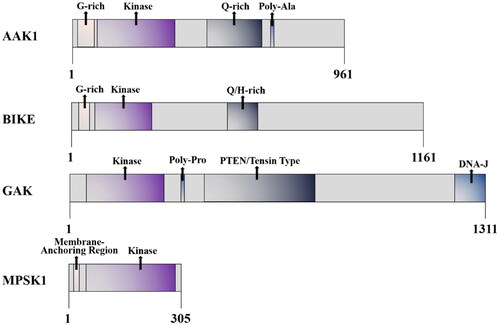
Figure 2. (A) The chemical structure of K252a. (B) Interaction of K252a with AAK1 (protein data bank (PDB) ID: 4WSQ). Inhibitors are shown in stick representation with yellow carbon atoms. Key interacting residues are shown and labelled.
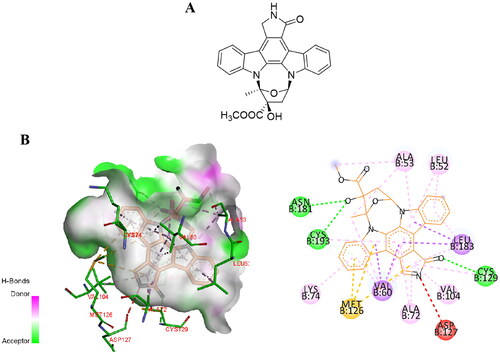
Figure 3. AAK1 medicates NF-κB and NDR1/2 signalling pathway. Left, AAK1 accelerates the degradation of IKBα, which leads to the activation of trans-acting factor p50/p65 and the transcription of pro-inflammatory cytokines, such as IL-6, TNF-αand IL-1β. Right, the Ser635 phosphorylation of AAK1 is regulated by phosphorylated NDR1/2, which was controlled by the upstream kinases MST1/2 and MAP4Ks. Phosphorylated AAK1 inhibits the growth of dendritic branches.
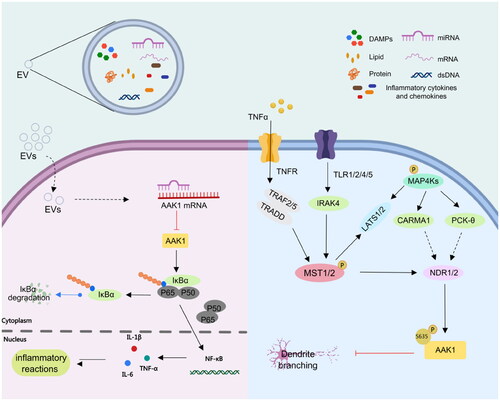
Figure 4. AAK1 participates in CDK16 and Nrg1 signalling pathway. Left, the phosphorylation of AAK1 Thr389 was controlled by CDK16, which was involved in the regulation of neuronal synaptic transmission. Right, AAK1 inhibits the Nrg1/Erbb4-dependent neurotrophic factor signal transduction. Inhibition of AAK1 results in the sustained activation of downstream signalling by ErbB4, leading to enhanced Nrg1-mediated neurogenesis.
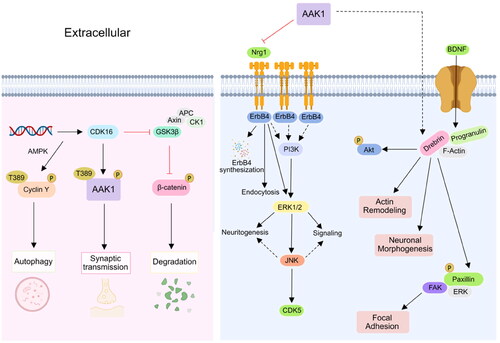
Figure 5. AAK1 is involved in Notch and WNT signalling pathway. Firstly, AAK1 mediates the interaction of Notch and Eps15b, which accelerates the Notch pathway. Secondly, AAK1 negatively regulates WNT signalling by promoting CME of LRP6. Meanwhile, WNT activates AAK1-activated AP2M1 phosphorylation to promote endocytosis.
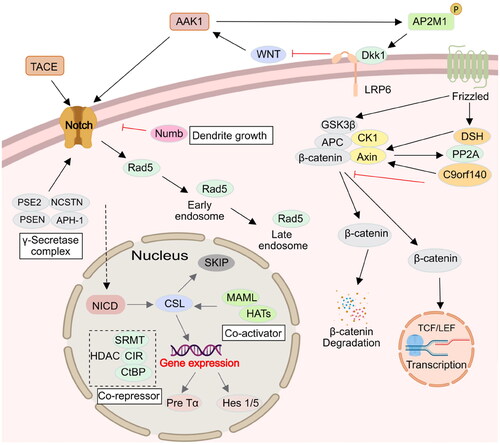
Figure 6. Relevance of AAK1 protein and therapies for human diseases. When AAK1 kinase is inhibited, it has a potential therapeutic effect, which is associated with neurological disorders and antiviral activity.
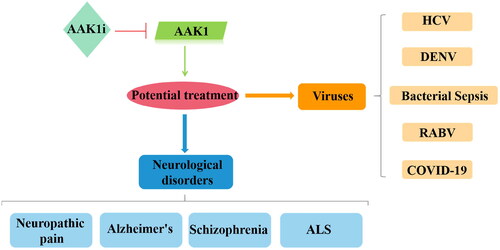
Figure 7. Different drugs currently on the market that act on JAK1/2, GAK, and AAK1 kinases to prevent virus invasion, mainly to inhibit the endocytosis of the virus.
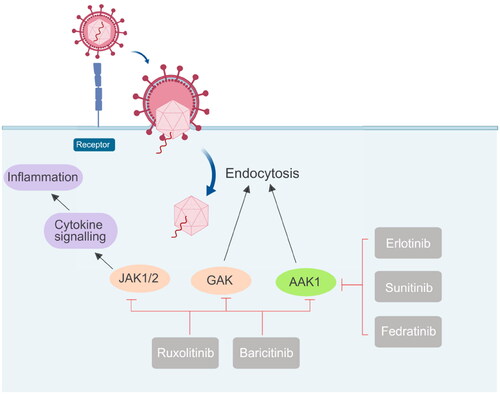
Figure 8. Pathological process after SARS-CoV-2 infection. First, SARS-CoV entered into lung epithelial cells, by binding of the virus to the ACE-2 receptor via spike proteins expressed on the surface of the virus. After the viruses proliferated in large numbers, the viruses can be recognised by neutrophils, macrophages, or T-cells. The inflammatory responses were triggered and the danger signalling molecules such as certain cytokines (e.g. IL-1, IL-8, etc.) were producted. In addition, immune response were elicited by reducing the number of CD4+ T-cells and CD8+ T-cells and increasing the number of Th17 cells.
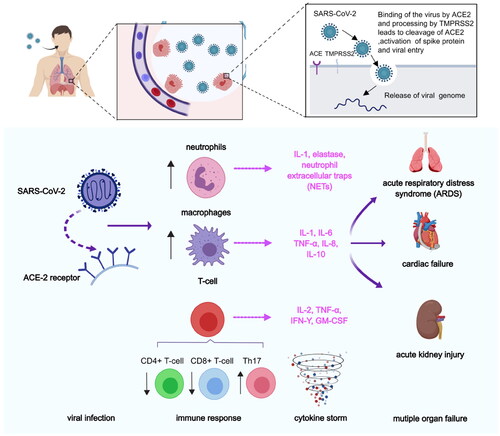
Figure 9. The chemical structures of patented AAK1 inhibitors with imidazo[1,2-b]pyridazine.
![Figure 9. The chemical structures of patented AAK1 inhibitors with imidazo[1,2-b]pyridazine.](/cms/asset/969606db-9353-403e-8a67-3c7bf6155b80/ienz_a_2279906_f0009_c.jpg)
Figure 10. The chemical structures of patented AAK1 inhibitors with Pyrazolo[1,5-a]pyrimidine. EC50: median effective concentration, the concentration of drugs that causes 50% of the organisms to produce some toxic effect; TC50: median toxic dose, the drug dose that causes poisoning in half of the experimental animals.
![Figure 10. The chemical structures of patented AAK1 inhibitors with Pyrazolo[1,5-a]pyrimidine. EC50: median effective concentration, the concentration of drugs that causes 50% of the organisms to produce some toxic effect; TC50: median toxic dose, the drug dose that causes poisoning in half of the experimental animals.](/cms/asset/800fca82-a804-4a9d-b594-e6d071649366/ienz_a_2279906_f0010_c.jpg)
Figure 11. Structures of the AAK1 inhibitors with the aryl amide scaffold or its analogs selected from the references.
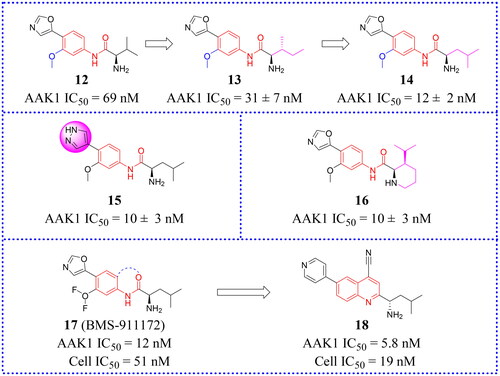
Figure 12. X-ray crystal structure of AAK1 in complex with compound 14 (PDB ID: 7LVH), 16 (PDB ID: 7LVI), 17 (PDB ID: 7RJ8) and 18 (PDB ID: 7RJ7). The compounds are rendered as a stick models with orange carbon atoms. Hydrogen bonds are shown as purple dashed lines.
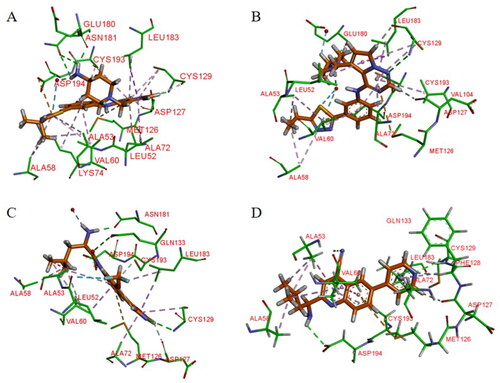
Figure 13. Structures of the AAK1 inhibitors with the Bis(hetero)aryl ethers or their analogs selected from Ref. Citation11, Citation68.
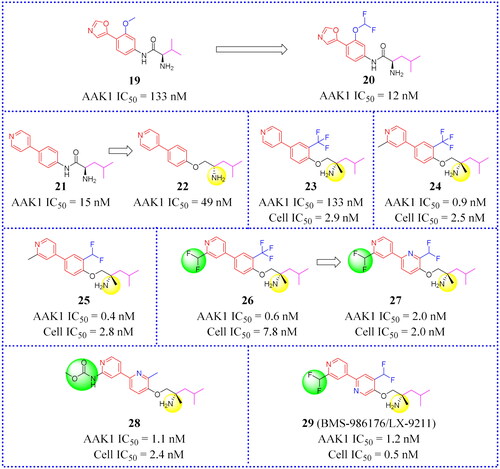
Figure 14. Chemical structures of approved drugs 30–32 and their derivatives 33–35.
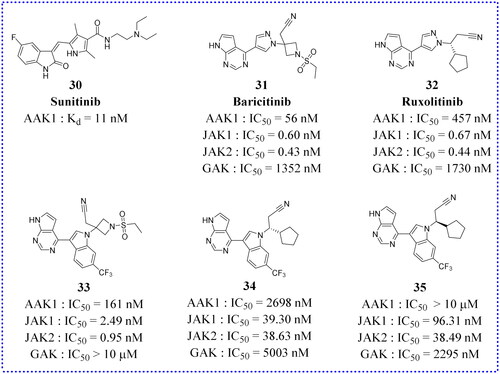
Table 1. Anti-viral activity of 30Citation51.
Figure 15. Structures of the AAK1 inhibitors based on the pyrrolo[2,3-b]pyridine scaffold or its analogs as selected from the references.
![Figure 15. Structures of the AAK1 inhibitors based on the pyrrolo[2,3-b]pyridine scaffold or its analogs as selected from the references.](/cms/asset/113eda2e-c1e3-49be-82d1-e42680ad2161/ienz_a_2279906_f0015_c.jpg)
Figure 16. X-ray crystal structure of AAK1 in complex with compound 37 (PDB ID: 5L4Q). The compound is rendered as a stick model with orange carbon atoms. Hydrogen bonds are shown as purple dashed lines.
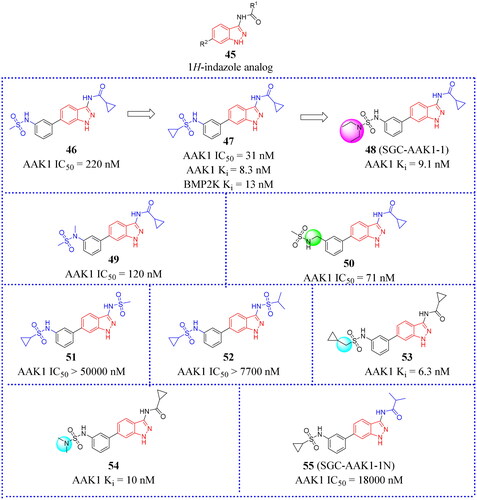
Figure 17. Structures of the AAK1 inhibitors with the 1H-indazole scaffold or its analogs selected from the references.