Figures & data
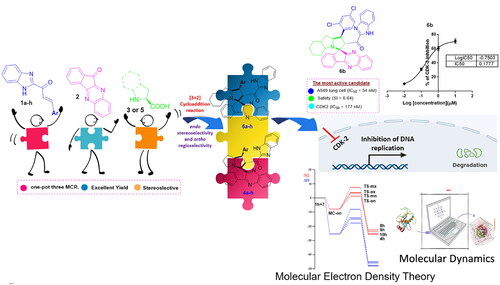
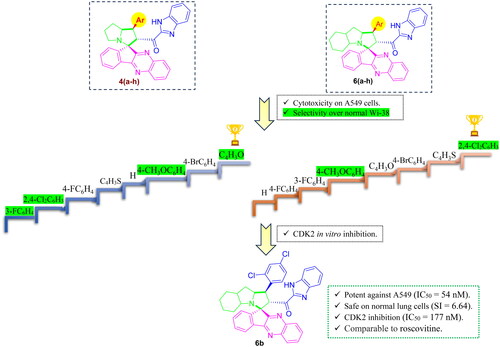
Figure 1. Rational design of the target indeno[1,2-b]quinoxaline-based spiro compounds 4(a-h) and 6(a-h) as CDK2 inhibitors for halting non-small cell lung cancer.
![Figure 1. Rational design of the target indeno[1,2-b]quinoxaline-based spiro compounds 4(a-h) and 6(a-h) as CDK2 inhibitors for halting non-small cell lung cancer.](/cms/asset/e5b71f02-7044-4084-b9c1-03d9dd62216b/ienz_a_2281260_f0001_c.jpg)
Scheme 1. Synthetic route of novel indeno[1,2-b]quinoxaline-based spiro compounds (4a-h, and 6a-h).
![Scheme 1. Synthetic route of novel indeno[1,2-b]quinoxaline-based spiro compounds (4a-h, and 6a-h).](/cms/asset/0b835a89-5947-47e7-80d6-e7985c2fbe16/ienz_a_2281260_sch0001_c.jpg)
Figure 2. ORTEP (single crystal X-ray diffraction analysis) of 4e.
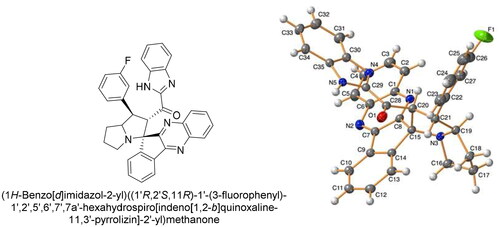
Table 1. B3LYP/6-31G(d) electronic chemical potential μ, chemical hardness η, electrophilicity ω and nucleophilicity N indices, in eV, of AY 7 and ethylene 1h.
Scheme 2. 32CA reaction of AY 7 with the ethylene 1h.
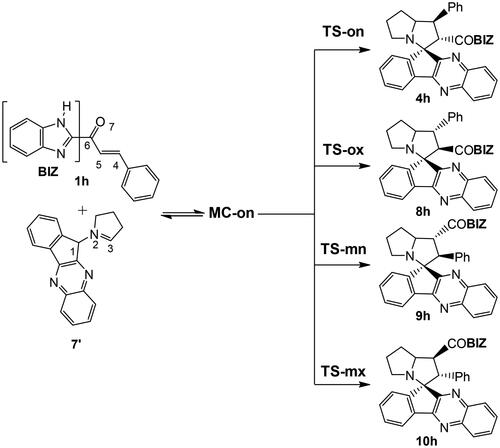
Table 2. ωB97X-D/6-311G(d,p) relative enthalpies (ΔH in kcal·mol−1), entropies (ΔS in cal·mol−1K−1), and Gibbs free energies (ΔG in kcal·mol−1), with respect to the separated reagents, computed at 337.75 K and 1 atm in methanol, for the stationary points involved in the 32CA reaction of AY 7 with ethylene 1h.
Figure 3. ωB97X-D/6-311G(d,p) enthalpy, in blue, ΔH in kcal mol−1, and Gibbs free energy, in red, ΔG in kcal mol−1, profiles, in methanol at 65 °C, for the 32CA reaction of AY 7 with the ethylene 1h.
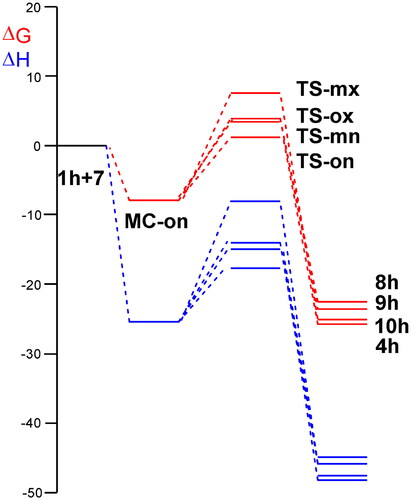
Figure 4. ωB97X-D/6-311G(d,p) geometry obtained in methanol of the TSs involved in the 32CA reaction of AY 7 with ethylene 1h. The distances are given in Angstrom.
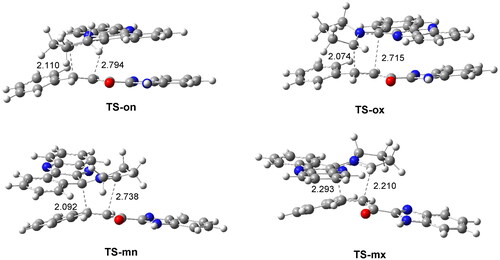
Table 3. Cytotoxicity screening of 4(a-h) and 6(a-h) against human lung fibroblasts (Wi-38) and lung cancer cells (A549) and their selectivity index (SI) values.
Figure 5. Morphological changes of A549 cells after 72 h treatment with the most active derivative 6b.
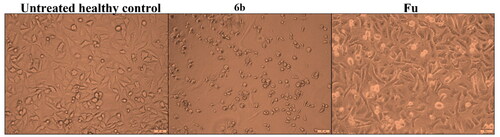
Figure 6. Binding pose of the reference drug roscovitine within the active site of CDK2 protein. The dashed black line depicts hydrogen bond interaction.
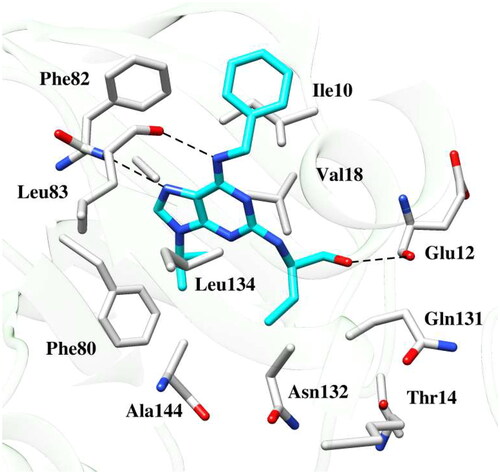
Figure 7. Binding poses of the active compound 6b with CDK2 protein (a) Docking pose (b) MD simulation pose. The protein residues of the target CDK2 protein are presented as light grey. The dashed black line depicts hydrogen bond interaction.
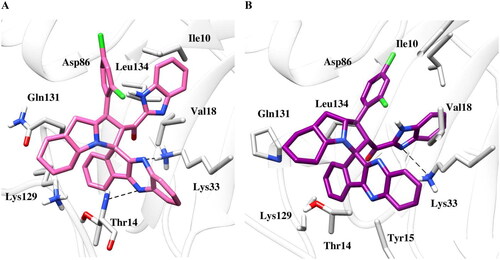
Figure 8. RMSD of the system calculated as a function of time.
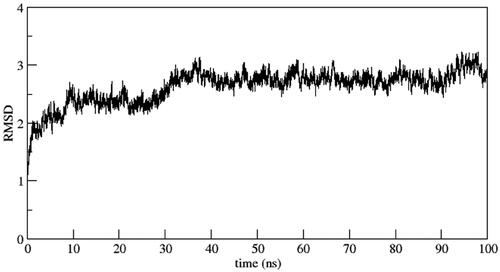
Figure 9. RoG of the system calculated as a function of time.
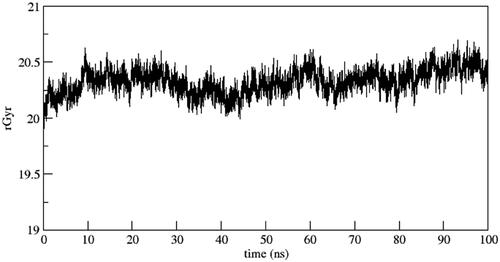
Figure 10. RMSF of the system calculated as a function of time.
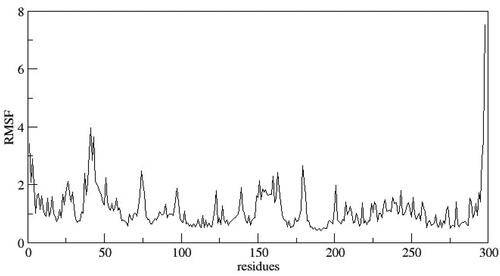
Figure 11. Dose-response curve for the CDK2 inhibition versus serial dilutions of compound 6b and roscovitine [0.01–10 μM].
![Figure 11. Dose-response curve for the CDK2 inhibition versus serial dilutions of compound 6b and roscovitine [0.01–10 μM].](/cms/asset/a83ca270-1791-4009-a26c-a1ebb34d3ba8/ienz_a_2281260_f0011_b.jpg)
Table 4. Summarised IC50 values with the percentage of CDK2 inhibition of compound 6b and roscovitine.
Figure 12. SAR of 4(a-h) and 6(a-h).