
Figures & data
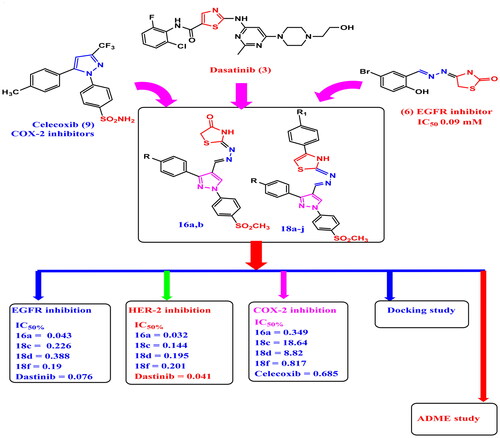
Figure 1. Structure of reversible EGFR inhibitor Erlotinib (1), irreversible EGFR inhibitor Dacamitinib (2), Dasatinib (3), Dabrafenib (4) EGFR inhibitor Pyrazolyl-thiazole derivatives (5a), (5b), EGFR inhibitor hydrazonoyl-thiazole derivative (6), EGFR inhibitor pyrazolyl-thiazolidinone derivative (7), HER2 and EGFR inhibitor Pyrazolyl-thiazole (8), selective COX-2 inhibitors Celecoxib (9), thiazole containing NSAID Fentiazac (10a), thiazole containing NSAID Sudoxicam (10b) and Meloxicam (10c).

Figure 2. Structural hyperdization of designed compounds from EGFR inhibitor Dasatinib (3), reported EGFR inhibitor Pyrazolyl-thiazole (5a,b), reported EGFR inhibitor Hydrazono-thiazole (6), reported EGFR inhibitor pyrazolyl-thiazolidinone, reported HER2 and EGFR inhibitor Pyrazolyl-thiazole (8), COX-2 inhibitors Celecoxib (9) and Meloxicam (10c).

Table 1. Cell cycle analysis of compounds 18d and control for breast MCF7 cells.
Table 2. Apoptosis of compounds 18d and control against breast MCF7 cell line.
Scheme 1. Reagents and conditions: (a) ethanol 95% reflux 12 h, (b) POCl3/DMF reflux 24 h, (c) thiosemicarbazide, ethanol 95%, reflux 10 h, (d) ethanol 95%, sod. acetate, reflux, 24 h, (e) ethanol 95%, pyridine, reflux, 24 h.

Table 3. In vitro COX-1 and COX-2 inhibitory activity of thiazole 16a,b, 18a–j and reference drugs indomethacin, celecoxib.
Figure 3. (a) 2D NOESY H1NMR of compounds 18a showing correlation between the pyrazole H-5 and olefinic proton of each geometrical isomer, (b) 2D NOESY H1NMR of compounds 18d showing correlation between the pyrazole H-5 and olefinic proton of each geometrical isomer, (c) 2D NOESY H1NMR of compounds 18g showing correlation between the pyrazole H-5 and olefinic proton of each geometrical isomer.


Table 4. In vitro MCF-7, A549, F180 inhibitory activity of thiazole containing derivatives 16a,b & 18a–j and reference drugs dasatinib & doxorubicin.
Figure 4. IC50 of compounds 16a, b & 18a–j against of MCF-7, A549, F180 cell lines and reference drugs dasatinib & doxorubicin.

Figure 5. IC50 values of compounds 16a, 18c, 18d and 18f compared to dasatinib on EGFR-WT, EGFR (L858R), EGFR (T790M/L858R).

Figure 6. IC50 values of compounds 16a, 18c, 18d, and 18f compared to that of dasatinib on HER-2.

Figure 7. SAR of in vitro anti-inflammatory and cytotoxic activities of compounds 16a,b, and 18a–j.

Figure 8. Compounds 18d effect on DNA-ploidy flow cytometric analysis of breast MCF-7 cells compared to negative control.

Figure 9. The percentage of Annexin-V-FITC-positive staining in breast MCF-7 cells when treated with compounds 18d compared to negative control.

Figure 10. (A) Visual representation (2D) of celecoxib docked with 3LN1 active site (B) Visual representation (2D) of compound 16a docked with 3LN1active site, (C) Visual representation (2D) of compound 16b docked with 3LN1 active site (D) Visual representation (2D) of compound 18c docked with 3LN1 active site (E) Visual representation (2D) of compound 18f docked with 3LN1 active site (F) Visual representation (2D) of compound 18d docked with 3LN1 active site.

Figure 11. (A) Visual representation (2D) of compound 16a docked with 1M17 active site, (B) Visual representation (2D) of compound 16b docked with 1M17 active site (C) Visual representation (2D) of compound 18c docked with 1M17 active site. (D) Visual representation (2D) of compound 18f docked with 1M17 active site (E) Visual representation (2D) of compound 18d docked with 1M17 active site (F) Visual representation (2D) of dasatinib docked with 1M17 active site.

Figure 12. (A) Visual representation (2D) of 16a docked with HER-2 active site (3PP0) (B) Visual representation (2D) of compound 16b docked with HER-2 active site (3PP0), (C) Visual representation (2D) of compound 18c docked with HER-2 active site (3PP0), (D)Visual representation (2D) of compound 18d docked with HER-2 active site (3PP0),(E) Visual representation (2D) of compound 18f docked with HER-2 active site (3PP0) (E) Visual representation (2D) of compound dasatinib docked with HER-2 active site (3PP0).

Table 8. Physicochemical parameters of compounds 16a, 16b, 18c, 18d, 18f and dsastinib.
Table 9. Pharmacokinetics of compounds 16a, 16b, 18c, 18d, 18f and dsastinib.
Table 10. Lipophilicity and water solubility of compounds 16a, 16b, 18c, 18d, 18f and dsastinib.
Table 11. Drug likeness of compounds 16a, 16b, 18c, 18d, 18f and dsastinib.
Figure 14. Structure activity relationship of synthesised compounds 16a, b and 18a–j.

Figure 13. The physicochemical diagram for the oral bioavailiability of compounds 16a, 16b, 18c, 18d, 18f and dasatinib.
