Figures & data
Figure 1. Chemical structures of harmine and its derivatives.
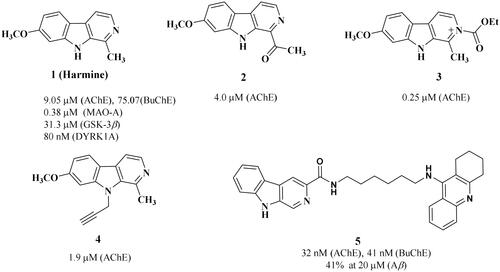
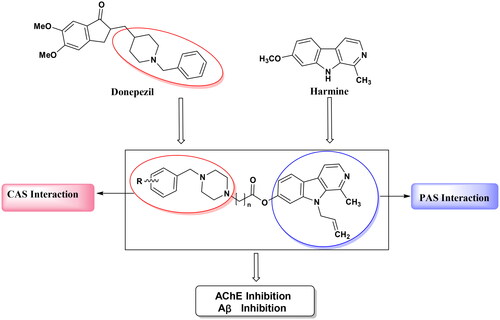
Figure 2. Design strategy for the new series of harmine derivatives targeting AChE and Aβ1-42 aggregation.
Scheme 1. Synthesis of compounds 11 − 15. Reagents and conditions: (i) NaH, DMF, rt; (ii) AcOH, HBr, reflux; (iii) Different acylbromides, EDCI, dry CH2Cl2, reflux; (iv) NaHCO3, EtOH, reflux.

Scheme 2. Synthesis of compounds 17a − 17l. Reagents and conditions: (i) NaHCO3, EtOH, reflux.
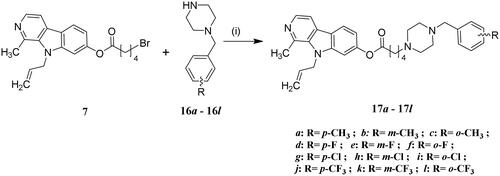
Table 1. Inhibition of hAChE, hBuChE, and Aβ1 − 42 aggregation by the synthesised compounds.
Table 2. Physiochemical properties for some active compounds, tacrine, donepezil, resveratrol and curcumin.
Table 3. Predicted ADME and toxicity results for some active compounds, tacrine, donepezil, resveratrol and curcumin.
Figure 3. AChE induced Aβ1-42 aggregation inhibition by compounds 13 and 17d. *** p < 0.001 vs control group.
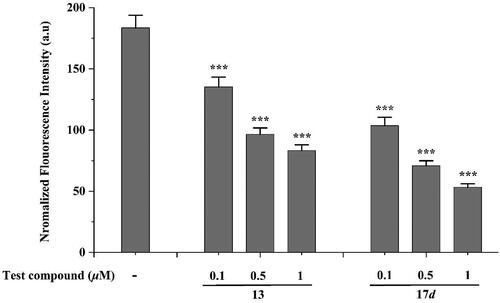
Figure 4. Neurotoxicity of compounds in SH-SY5Y cells. *p < 0.05, **p < 0.01 and *** p < 0.001 vs control group (untreated cells).
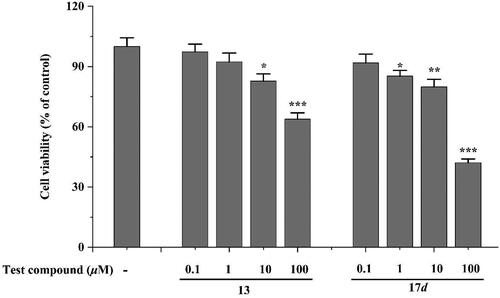
Figure 5. Neuroprotective effects of compounds 13 and 17d against Aβ1-42-induced cell death in SH-SY5Y cells. # p < 0.05 and ### p < 0.001 vs control group (untreated cells); *p < 0.05 and ***p < 0.001 vs Aβ1-42-treated cells.
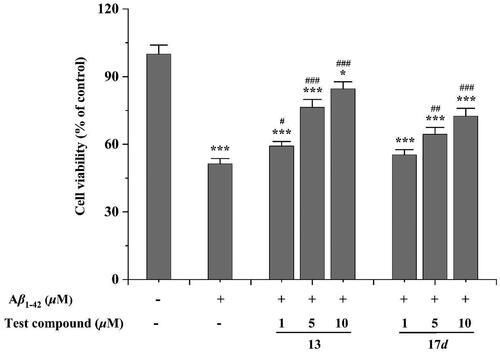
Figure 6. The Lineweaver-Burk plot of hAChE exhibits competitive inhibition with compound 13.
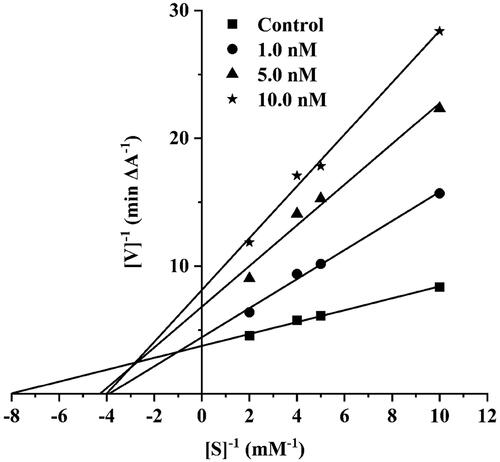
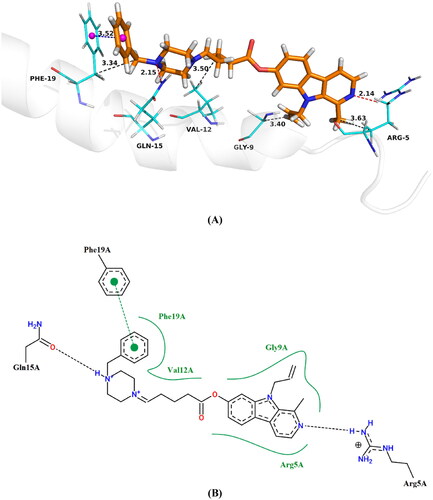
Figure 7. Proposed binding mode of compound 13 inside AChE active site, (A) 3D image, the blue dashed lines stand for π-π stacking, the red dashed lines represent hydrogen bondsnd and the black dashed lines mean hydrophobic interaction (B) 2D image.
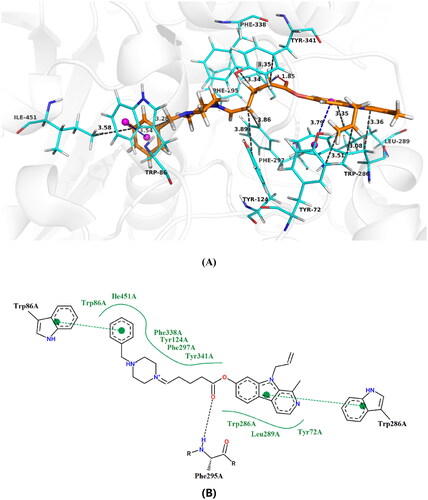
Figure 8. Proposed binding mode of compound 13 inside Aβ1-42 active site, (A) 3D image, the blue dashed lines stand for π-π stacking, the red dashed lines represent hydrogen bondsnd and the black dashed lines mean hydrophobic interaction, (B) 2D image.