
Figures & data
Figure 1. Chemical structures of CA-4, its analogs, and representative target compound.
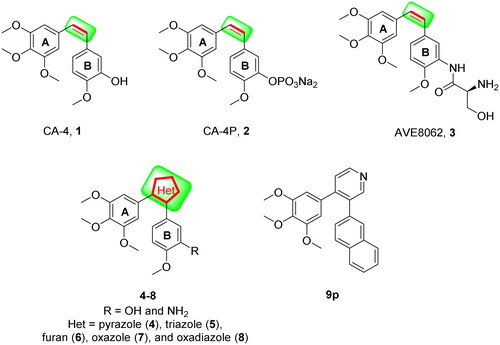
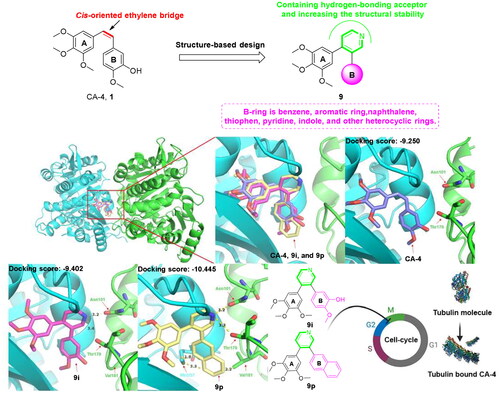
Figure 2. The rational design of target compounds.
Scheme 1. Reagents and conditions (a) LDA, THF, -85 °C, then I2/THF, -78 °C, overnight; (b) 3,4,5-trimethoxyphenylboric acid, Pd(PPh3)4, K2CO3, 1,4-dioxane/H2O, N2 atmosphere,125 °C, M.W., 20 min; (c) Substituted phenylboronic acid, Pd(PPh3)4, K2CO3, 1,4-dioxane/H2O, N2 atmosphere,126 °C, M.W., 25 min.
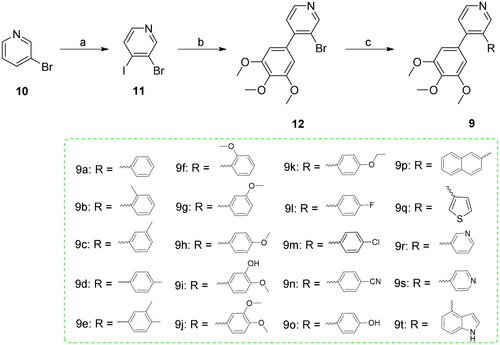
Table 1. In vitro anticancer activity (IC50 in μM) a,b and docking score of the compounds (9a-t).
Figure 3. A cell-free tubulin polymerisation assay of 9p with purified tubulin. CA-4 and paclitaxel were used as positive and negative controls, respectively.
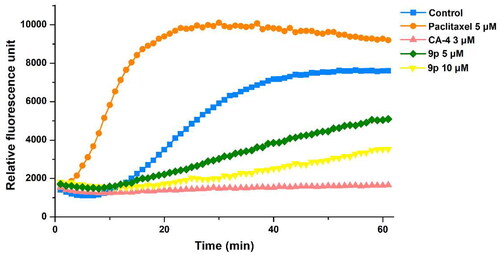
Figure 4. Effects of compound 9p (0.1 µM and 0.2 µM) and CA-4 (0.08 µM), on the cellular microtubule network and microtubule reassemble by immunofluorescence.
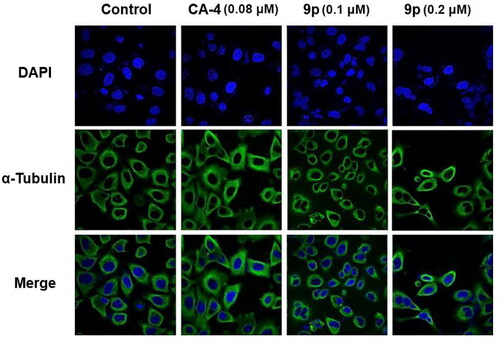
Figure 5. Effects of compound 9p on cell cycle. HeLa cell lines were treated with compound 9p (0.1 µM, 0.2 µM, and 0.4 µM) for 24 h.
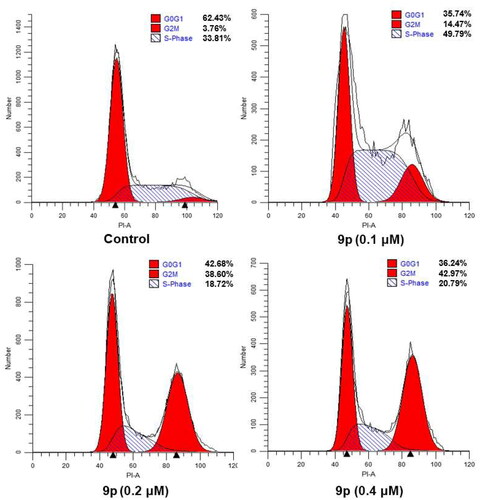
Figure 6. Analyses of apoptosis induction in Hela cells. Cells were harvested and stained with Annexin-V/PI for analysis after treatment with different concentrations of compound 9p (0.1 µM, 0.2 µM, and 0.4 µM) and control for 48 h. The diverse cell stages were given as live (Q4), early apoptotic (Q3), late apoptotic (Q2), and necrotic cells (Q1).
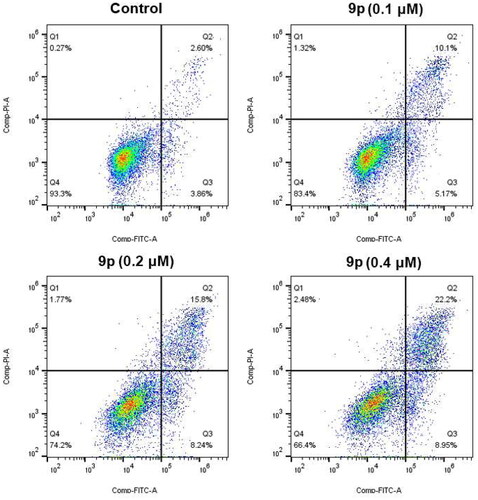
Table 2. Prediction of physicochemical properties of CA-4, 9i, and 9pTable Footnotea.