Figures & data
Figure 1. Chemical structures of the isolated compounds.
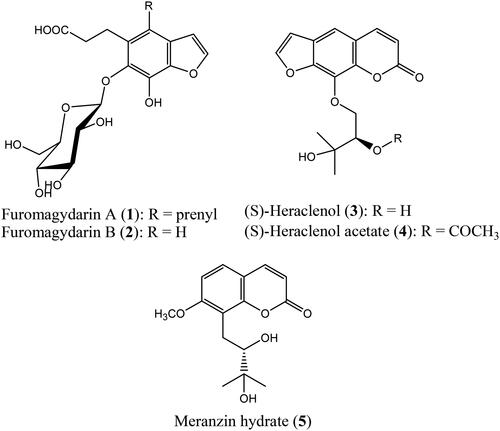
Table 1. 1H (600 MHz) and 13C (100 MHz) NMR data for compounds 1–2 (CD4O, δ in ppm).
Figure 2. Main HMBC and DQF-COSY correlations of compounds 1–2.
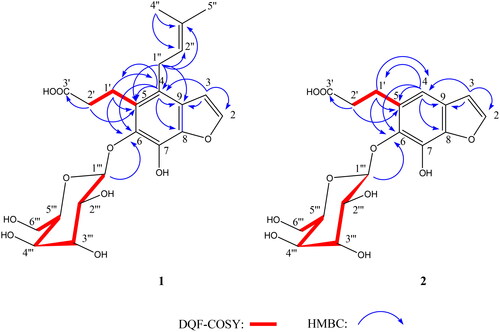
Figure 3. Furomagydarin A reduced COX-2 expression in LPS-stimulated RAW264.7 macrophages. (A) Cells were treated with vehicle or indicated concentrations of furomagydarin A for 30 min, followed by the treatment with LPS (100 ng/ml) for another 24 h. The COX-2 level was determined by immunoblotting. Each column represents the mean ± SEM of seven independent experiments. (B) Cells were treated with vehicle or indicated concentrations of furomagydarin B for 30 min, followed by the treatment with LPS (100 ng/ml) for another 24 h. The COX-2 level was determined by immunoblotting. Each column represents the mean ± SEM of six independent experiments. (C) Cells were treated with furomagydarin A (1–10 μM) for 30 min, followed by the treatment with LPS (100 ng/ml) for another 6 h. The extent of COX-2 mRNA was determined by an RT-qPCR assay as described in the ‘Materials and methods’ section. Each column represents the mean ± SEM of eight independent experiments. (D) Cells were transiently transfected with COX-2-luc or COX-2–3’UTR-luc and renilla-luc for 24 h. Luciferase activity was determined after treatment with LPS (100 ng/ml) for another 24 h. Data represent the mean ± SEM of eight independent experiments performed in duplicate. *P < 0.05, compared with the control group; #P < 0.05, compared with the group treated with LPS alone. (E) Cells were treated with furomagydarin A (10 μM) for 24 h. Cell viability was then determined using MTT and trypan blue exclusion assays. Data represent the mean ± SEM of four independent experiments performed in duplicate.
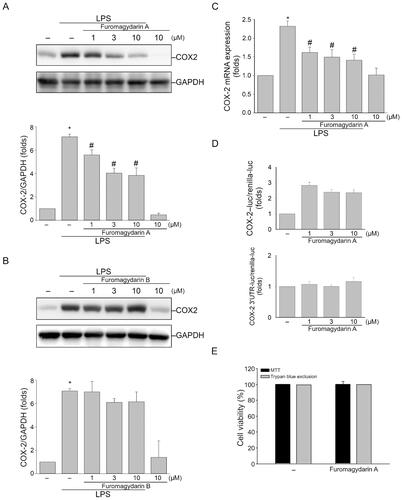
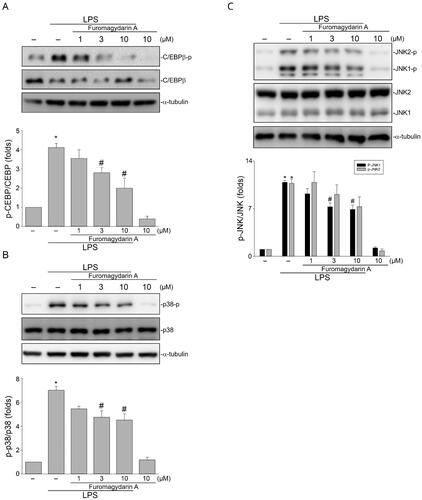
Figure 4. Furomagydarin A reduced LPS-induced C/EBP, p38MAPK or JNK phosphorylation in RAW264.7 macrophages. Cells were treated with furomagydarin A for 30 min, followed by the treatment with LPS (100 ng/ml) for another 30 min. The extent of C/EBP (A), p38MAPK (B) or JNK (C) phosphorylation was determined by immunoblotting. Each column represents the mean ± SEM of six independent experiments. *p < 0.05, compared with the control group; #p < 0.05, compared with the group treated with LPS alone.