
Figures & data
Figure 1. Chemical structure of (A) Daidzein, (B) 734THIF and (C) 784THIF.
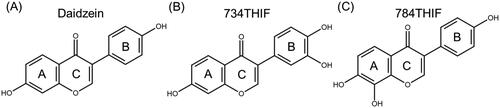
Table 1. Primary antibodies used.
Figure 2. Three-dimensional (3D) and two-dimensional (2D) schematic diagrams of the docking poses of celecoxib (A), daidzein (B), 734THIF (C), and 784THIF (D) within the COX-2 active site (PDB code 3LN1). Green structures in the 3D plot: the analysed compounds.
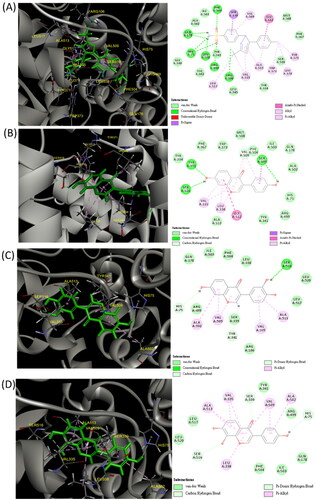
Table 2. Docking score and binding energy of daidzein, 734THIF, 784THIF, celecoxib, and sorafenib with COX-2 and VEGFR2.
Figure 3. Three-dimensional (3D) and two-dimensional (2D) schematic diagrams of the docking poses of sorafenib (A), Daidzein (B), 734THIF (C), and 784THIF (D) within the VEGFR2 active site (PDB code 4ASD). Green structures in the 3D plot: the analysed compounds.
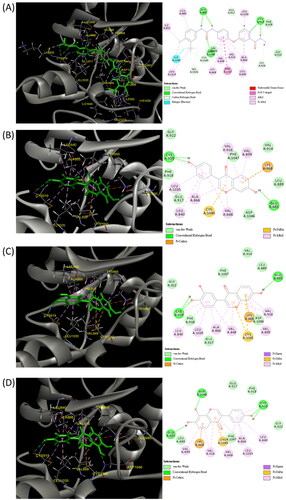
Figure 4. Viability of HepG2 cells treated with 734THIF (A) and 784THIF (B) under different oxygen conditions. HepG2 cell viability was analysed using MTT. n = 3 in each group; *P < 0.05 compared with 0 h normoxic control; #P < 0.05 compared with other conditions.
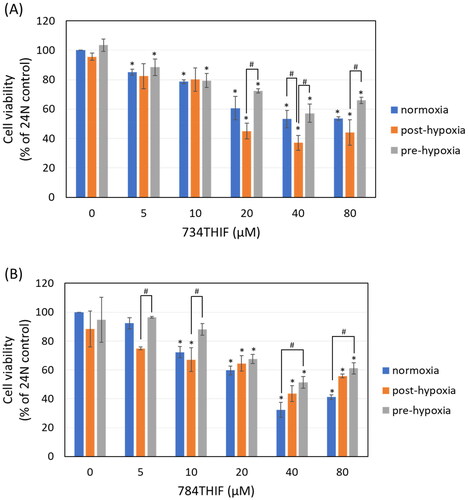
Figure 5. Expression of hypoxia-related proteins in HepG2 cells. (A), (C), and (E) indicate the expression of HIF1a, VEGF, and CAV-1, respectively, under post-hypoxic conditions; (B), (D), and (F) indicate the expression of HIF1a, VEGF, and CAV-1, respectively, under pre-hypoxic conditions. n = 3 in each group; #P < 0.05 compared with normoxic control; * P < 0.05 compared with hypoxic control; $P < 0.05 734THIF compared with 784THIF.
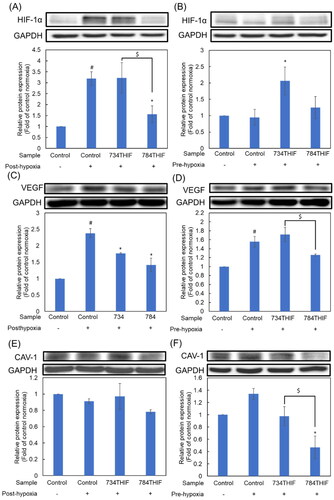
Figure 6. Expression of a pro-inflammatory protein and oxidative homeostasis-related proteins in HepG2 cells. (A), (C), and (E) indicate the expression of COX-2, NRF-2, and SIRT-1, respectively, under post-hypoxic conditions; (B), (D), and (F) indicate the expression of COX-2, NRF-2, and SIRT-1, respectively, under pre-hypoxic conditions. n = 3 in each group; #P < 0.05 compared with normoxic control; * P < 0.05 compared with hypoxic control; $P < 0.05 734THIF compared with 784THIF.
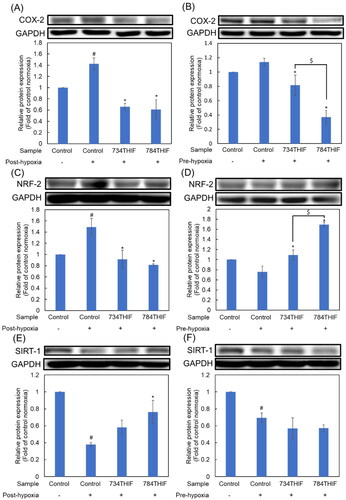
Figure 7. Expression of EMT makers in HepG2 cell. (A), (C), and (E) indicate the expression of E-cad, N-cad, and vimentin, respectively, under post-hypoxic conditions; (B), (D), and (F) indicate the expression of E-cad, N-cad, and vimentin, respectively, under pre-hypoxic conditions. n = 3 in each group; #P < 0.05 compared with normoxic control; * P < 0.05 compared with hypoxic control; $P < 0.05 734THIF compared with 784THIF.
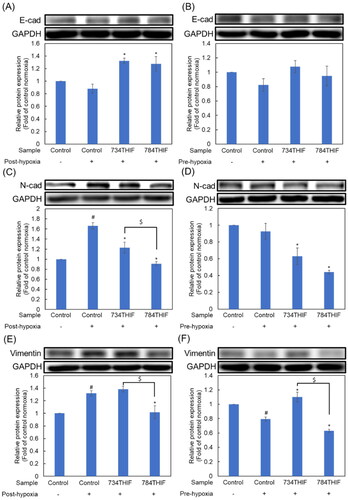
Figure 8. Expression of MMP-9 in and migration rate of HepG2 cells treated with 734THIF and 784THIF. The expression of MMP-9 under post-hypoxic (A) and pre-hypoxic conditions (B), respectively. Wound healing assay (C) and its closure percentage at different time points (D). n = 3 in each group; #P < 0.05: compared with normoxic control; *P < 0.05: compared with hypoxic control; $P < 0.05: 734THIF compared with 784THIF.
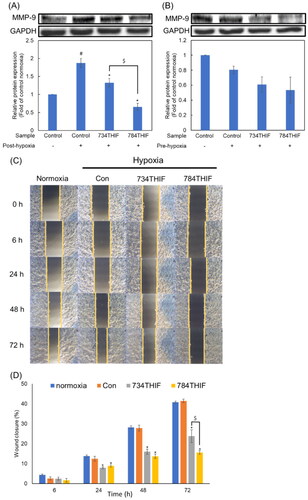
Figure 9. Expression of MAPKs (p-ERK and p-p38) and anti-apoptosis proteins in HepG2 cells. (A), (C), and (E) indicate the expression of p-ERK, p-p38, and BCL-2, respectively, under post-hypoxic conditions; (B), (D), and (F) indicate the expression of p-ERK, p-p38, and BCL-2, respectively, under pre-hypoxic conditions. n = 3 in each group; #P < 0.05 compared with normoxic control; * P < 0.05 compared with hypoxic control; $P < 0.05 734THIF compared with 784THIF.
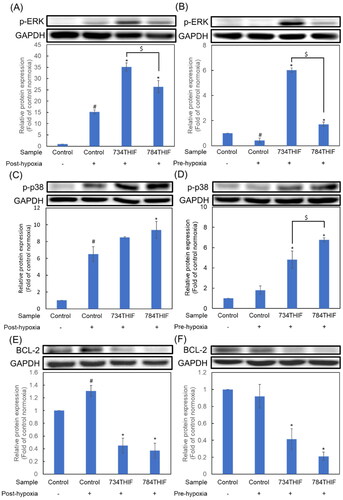
Table 3. Percentage of protein expression inhibition by 734THIF and 784THIF under different hypoxic conditions.
Table 4. 734THIF and 784THIF levels in HepG2 cells under normoxic and different hypoxic conditions.
Data availability statement
The data that support the findings of this study are available from the corresponding author on reasonable request. Some data may not be made available because of privacy or ethical restrictions.