Figures & data
Figure 1. Representative examples of HSP90 C-terminal inhibitors.
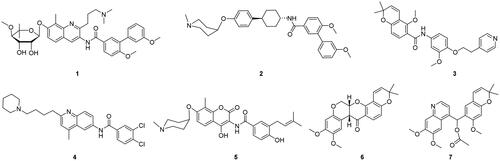
Figure 2. Ligand-based pharmacophore model. (A) Top-ranked pharmacophore model (pharmacophore_01). Hydrophobic and hydrogen bond acceptor features are coloured blue and green, respectively. (B) Alignments of seven HSP90 C-terminal inhibitors with the pharmacophore_01 model.
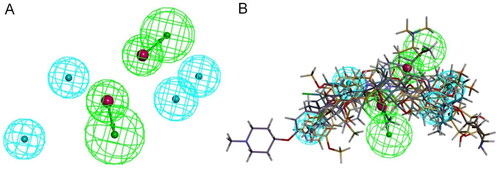
Figure 3. Virtual screening flow.
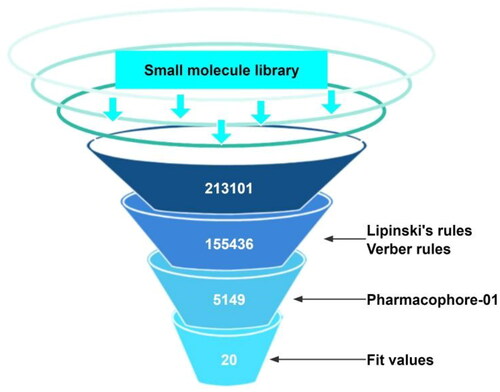
Figure 4. FitValue evaluation results and antiproliferative activity against MCF-7 cells of representative compounds. IC50 values (μM) were presented as the mean ± SD from three independent experiments.
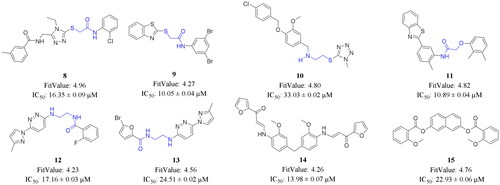
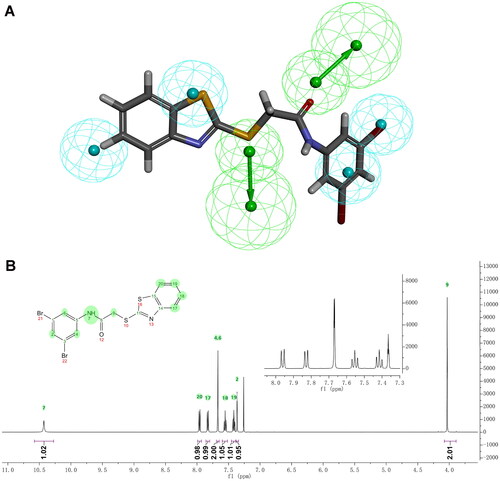
Figure 5. Alignment of 9 with pharmacophore model_01 and characterisation of 9. (A) Alignment of 9 with pharmacophore model_01. (B) 1H NMR spectrum of 9 in CDCl3.
Scheme 1. Synthetic route of 2-heteroarylthio-N-arylacetamides 16–32. Reagents and conditions: (a) Et3N, CH2Cl2, r.t; (b) Et3N, THF, 60 °C.
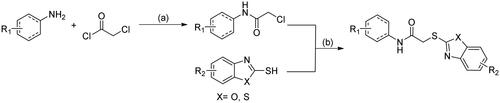
Table 1. Antiproliferative activity of 2-heteroarylthio-N-arylacetamides. 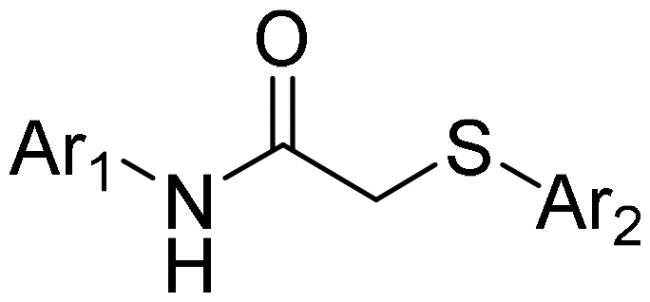
Figure 6. Effects of 9 and 27 on the viability of cancer cells. Cancer cells were treated with 9 (A–H) or 27 (I-P) for 48 h at indicated concentrations. Cell viability was determined by the MTT assay. The data represent the mean ± SD. *p < 0.05, **p < 0.01, ***p < 0.001 and ****p < 0.0001 by one-way ANOVA compared with vehicle-treated control group.
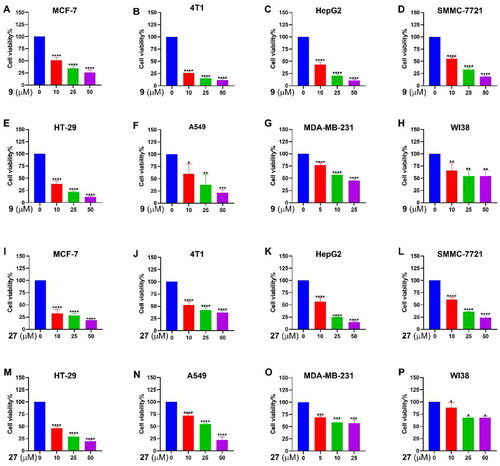
Figure 7. Effects of 9 and 27 on cell apoptosis determined by flow cytometry. (A, B) Apoptosis rate in MCF-7 cells treated with 9 (A) and 27 (B) at indicated concentrations. (C, D) Statistical analysis of the percentage of apoptosis rate of 9 (C) and 27 (D). Data represent the mean ± SD of three independent experiments. **p < 0.01 and ****p < 0.0001 compared to the control group.
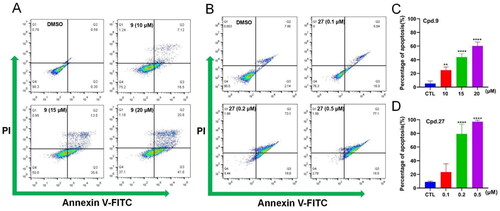
Figure 8. HSP90α C-terminal domain TR-FRET assay. (A) The principle of TR-FRET assay. (B–D) The C-terminal HSP90 activity after the treatment with 9, 27, 28 and novobiocin at the indicated concentrations. Novobiocin was evaluated at a concentration of 500 μM. Data represent the mean ± SD. *p < 0.05, **p < 0.01, ***p < 0.001 and ****p < 0.0001 by one-way ANOVA compared with vehicle-treated control group.
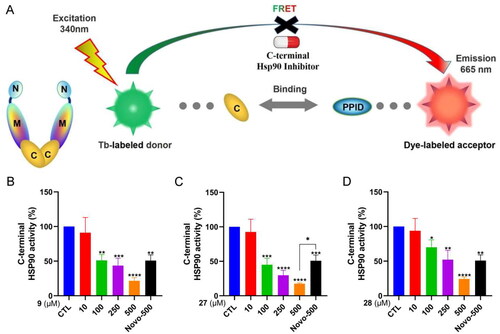
Figure 9. Western blotting assays. (A) Expression of HSP90, HSP70, ERK, p-AKT in MCF-7 cells after 24 h treatment with 27; quantification analysis of detected proteins HSP90 (B), HSP70 (C), ERK (D), and p-AKT (E). Data represent the mean ± SD. *p < 0.05, **p < 0.01, ***p < 0.001 and ****p < 0.0001 by one-way ANOVA compared with vehicle-treated control group.
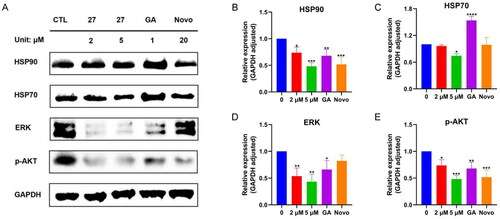
Figure 10. Predicted binding modes and interactions of 9 and 27 with HSP90 (PDB ID: 7RY1). (A) Binding pose of 9 and 27 in the HSP90 binding site. 9 and 27 are referred as CPK model. (B) Interactions between 9 and HSP90. (C) Interactions between 27 and HSP90.
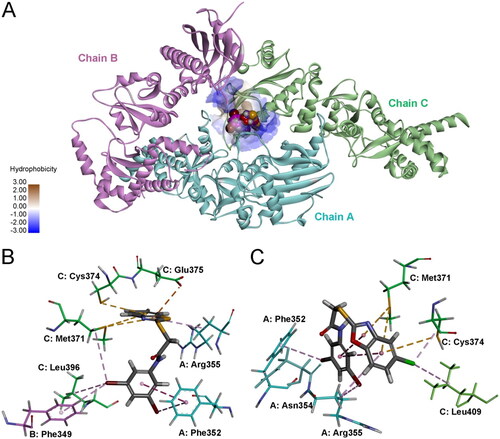
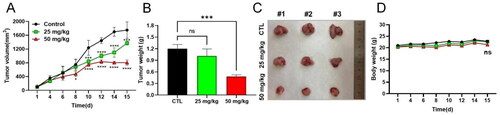
Figure 11. In vivo assay of the antitumour activity of 9 in 4T1 tumour-bearing mice models. (A) tumour volume change after administration of 9 in two weeks. The tumour volumes were determined every other day. (B) Statistical analysis of the tumour weight in the indicated groups after two weeks administration of 9. (C) Photographs of tumours in the indicated groups after two weeks of administration of 9. (D) Statistical analysis of the body weights in the indicated groups in two weeks. The body weights were determined every other day. Data represent the mean ± SD. ns, p > 0.05, not significantly different from the control group. *p < 0.05, **p < 0.01, ***p < 0.001 and ****p < 0.0001 by one-way ANOVA compared with vehicle-treated control group.