Figures & data
Figure 1. The reported AXL inhibitors and HDAC inhibitors.
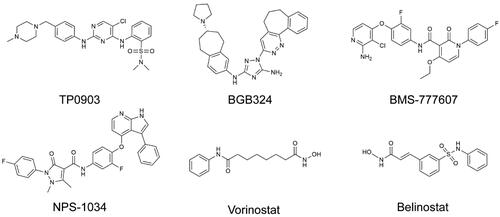
Figure 2. The chemical structures of Hits 1–5.
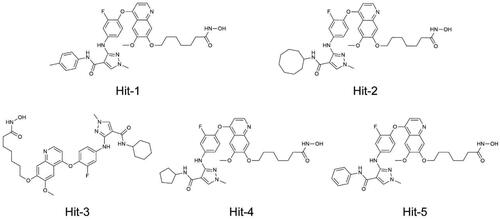
Figure 3. Identification of dual-targeting AXL/HDAC2 inhibitors. (A) Pharmacophore model based on AXL (F1 and F2 are hydrophobic characteristics, F3 is aromatic characteristics, and F4 is hydrogen bond donor characteristics). Pharmacophore characteristics are represented by spheres. Hydrogen bonds are represented by the black dotted line. (B) The identification process of dual–targeting AXL/HDAC2 inhibitors.
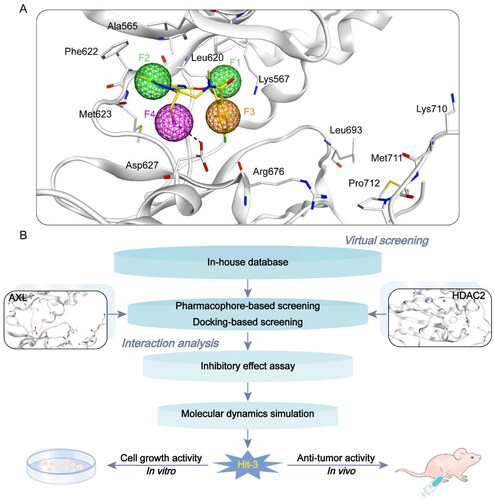
Figure 4. The docking validation using the co-crystal ligand and protein complex before setting screening threshold values and docking-based virtual screening. (A) The docking validation of AXL (PDB ID: 5U6B). (B) The docking validation of HDAC2 (PDB ID: 4LXZ). (yellow for native ligand, green for docking ligand).
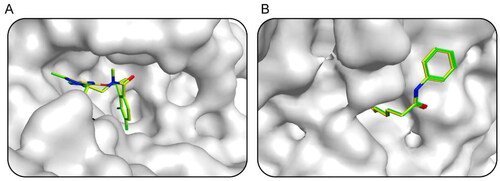
Figure 5. The docking scores of Hits 1–5, TP0903 and SAHA. aBinding free energy between the compounds and the targets (lower binding free energies show stronger binding affinities).
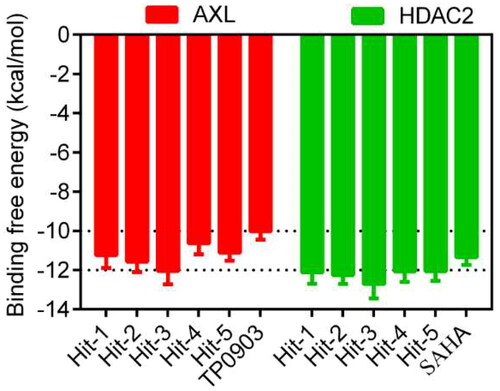
Figure 6. The X-ray crystal structure and the predicted docking poses of Hits 1–5 at the AXL active site: (A,B) Hit-1; (C,D) Hit-2; (E,F) Hit-3; (G,H) Hit-4; (I,J) Hit-5. Compounds are indicated as sticks with different atom colours (red for Hit-1, green for Hit-2, cyan for Hit-3, orange for Hit-4, dark blue for Hit-5). AXL is colour-coded by gray. The surfaces of AXL are colour-coded by gray. Hydrogen bonds are indicated by dashed black lines.
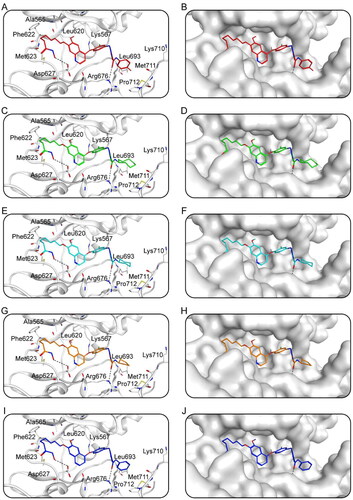
Figure 7. The X-ray crystal structure and the predicted docking poses of Hits 1–5 at the HDAC2 active site: (A,B) Hit-1; (C,D) Hit-2; (E,F) Hit-3; (G,H) Hit-4; (I,J) Hit-5. Compounds are indicated as sticks with different atom colours (red for Hit-1, green for Hit-2, cyan for Hit-3, orange for Hit-4, dark blue for Hit-5). HDAC2 is colour-coded by gray. The surfaces of HDAC2 are colour-coded in gray. Hydrogen bonds are indicated by dashed black lines.
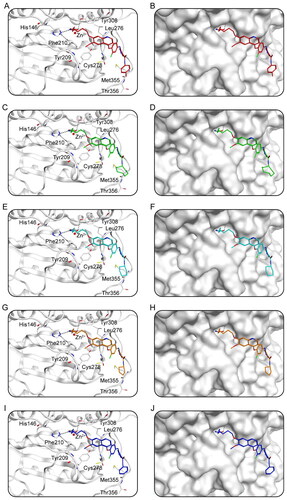
Table 1. The enzymatic inhibitory effects of Hits 1–5, TP0903 and SAHA in cell-free assays.
Table 2. The inhibitory effects of Hit-3 on other HDAC enzymes.
Figure 8. Molecular dynamics simulation of the Hit-3 with AXL and HDAC2. (A,B) RMSD of Hit-3 in complex with AXL and HDAC2, respectively. (C,D) RMSF of amino acid residues of Hit-3 in complex with AXL and HDAC2, respectively. (E,F) The secondary structures analysis of Hit-3 in complex with AXL and HDAC2, respectively. (black for Structure, red for Coil, green for B-Sheet, dark blue for B-Bridge, yellow for Bend, pink for Turn, grey for A-Helix, purple for 5-Helix and blue for 3-Helix).
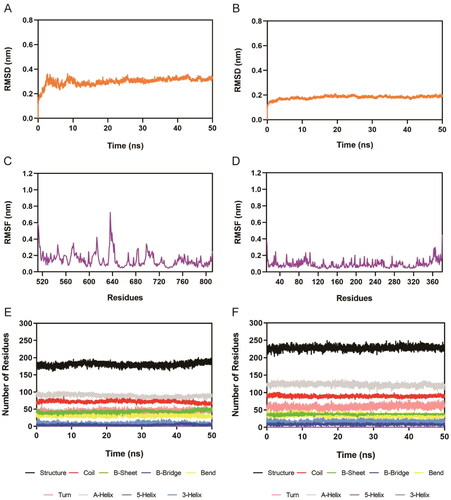
Figure 9. Inhibitory effects of Hits 1–5, TP0903 and SAHA on HCT116 cells.
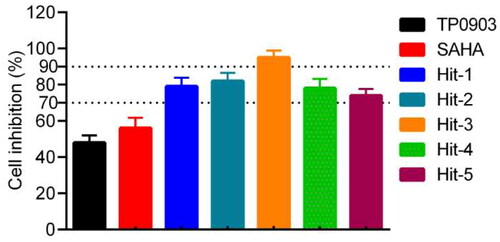
Figure 10. Inhibitory effects of Hit-3 on HCT116 cells detected by using MTT assay.
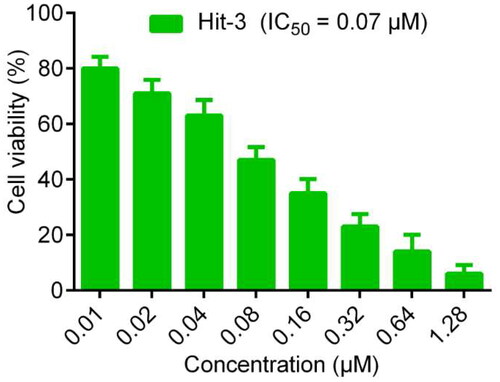
Table 3. The inhibitory activity of Hit-3 on other cancer cells and drug-resistant cancer cells.
Figure 11. Changes of tumour volume with injecting HCT116 (KRAS(mut)/p53(wt)) cells in BALB/c nude mice over time. The data are shown as mean ± SD, n = 5. ***p < .001 means a significant difference versus the vehicle group.
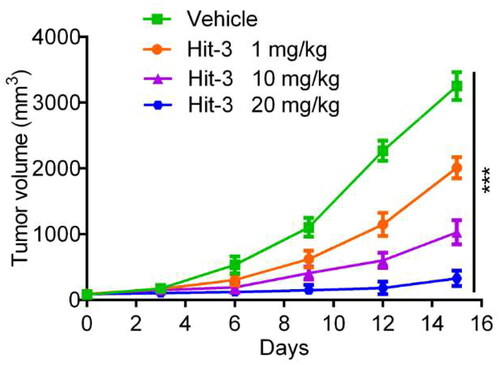
Table 4. In vivo pharmacokinetic parameters of Hit-3 after intraperitoneal administration in micea.
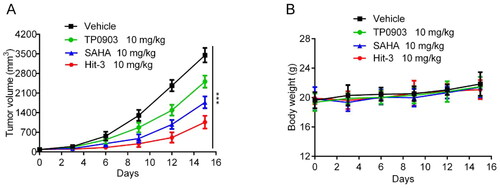
Figure 12. In vivo anticancer activity. (A) Tumour volume evaluations at the dose of 10 mg/kg for TP0903, SAHA, Hit-3 and vehicle. (B) Body weight evaluations after injecting vehicle, TP0903, SAHA and Hit-3 at the dose of 10 mg/kg. The data are shown as mean ± SD, n = 5. ***p < .001 means a significant difference versus the vehicle group.