Figures & data
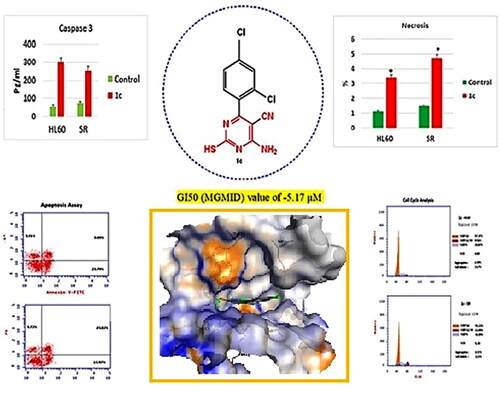
Figure 1. Anticancer drugs have pyrimidine ring.
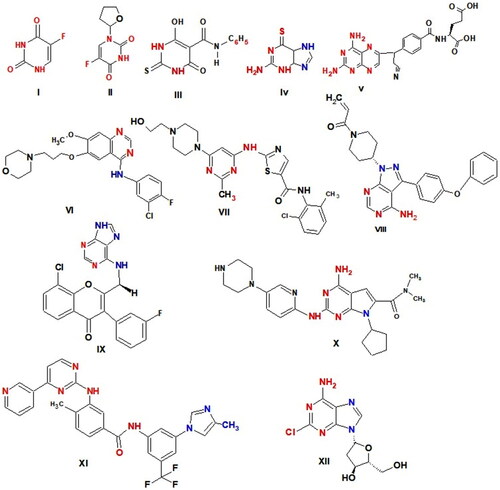
Figure 2. Pyrimidine -5-carbonitril derivatives as anticancer agents.
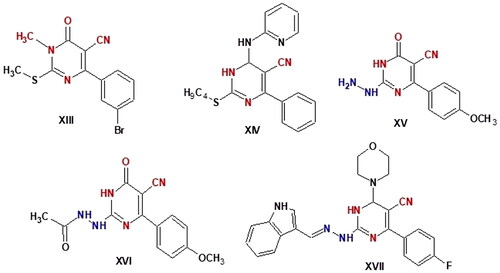
Figure 3. Reported pyrimidine derivatives (XVIII–XXII) with apoptotic activity.
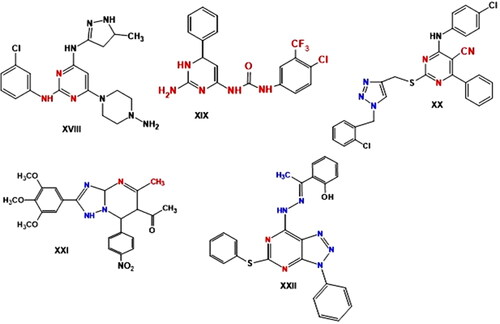
Figure 4. Structure of some reported PI3K inhibitors.
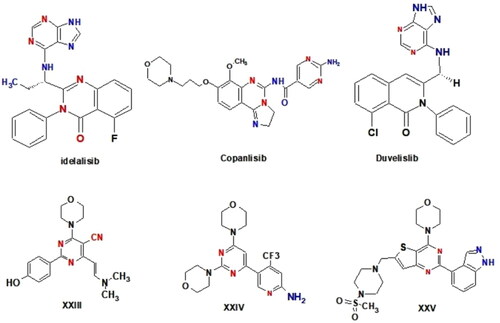
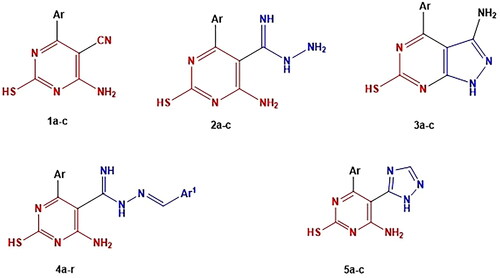
Figure 5. The designed compounds as anticancer, apoptotic inducing agents and PI3K inhibitors.
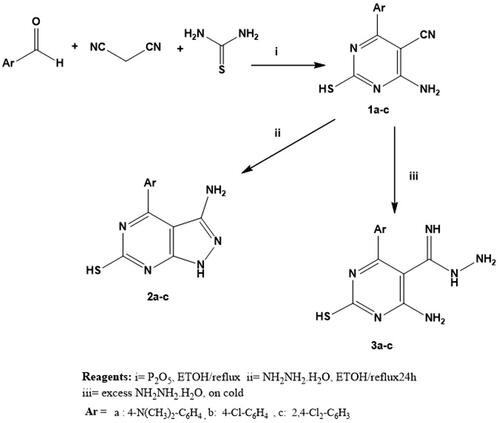
Scheme 1. Synthesis of compounds (1a-c) -(3a-c)
Scheme 2. Synthesis of novel hydrazone derivatives (4a-r) and triazole derivatives (5a-c).
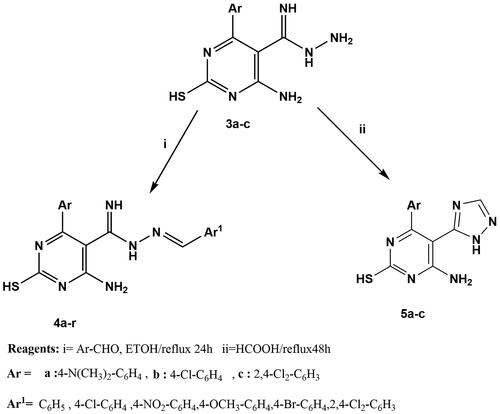
Figure 6. Mean % growth of compounds 1a- 4c.
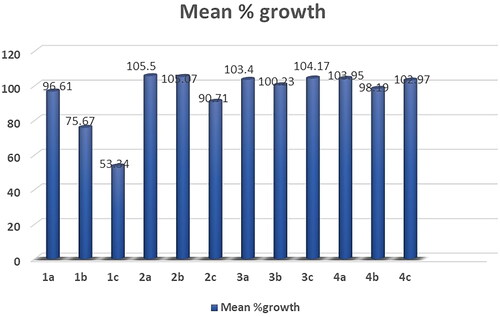
Figure 7. Mean % growth of compounds 4d- 4n.
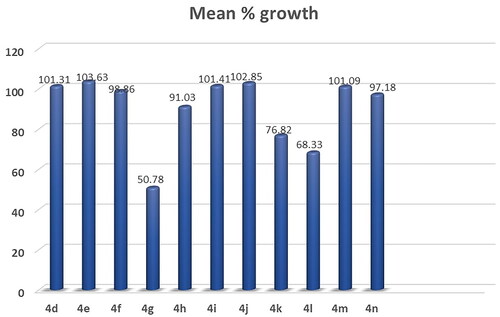
Figure 8. Mean % growth of compounds 4o- 5c.
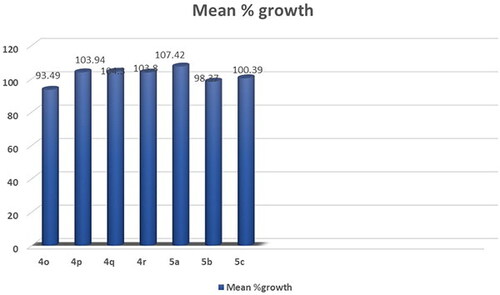
Table 1. Selectivity of compound 1c on nine human cancer cell types.
Table 2. IC50 (µM)Table Footnotea of compound 1c.
Figure 9. dose response curves of compound 1c against 60 cancer cell lines.
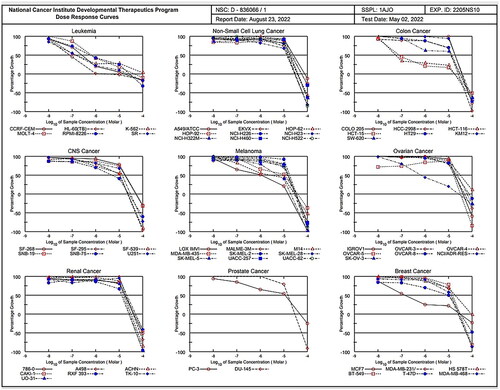
Figure 10. Flow cytometric analysis of cell cycle phases after compound 1c treatment in HL60 and leukaemia SR cell lines. (A & C) The histograms represent the cell cycle distribution of control (HL60 & leukaemia SR cells). (B & D) The histograms represent the cell cycle distribution of compound 1c treated cells. (E) A column graph represents the percentage of cells in each phase of the cell cycle in compound 1c treated.
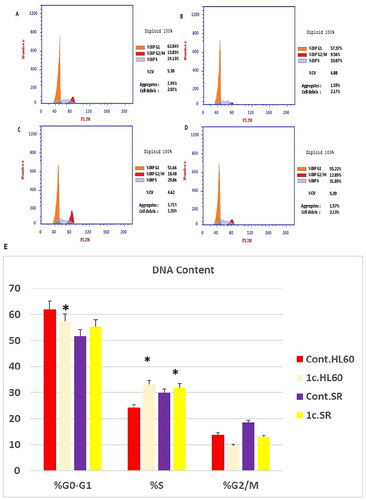
Figure 11. Apoptosis assay after treatment with compound 1c on HL 60 and leukaemia SR cells. (A & C) The cytograms show apoptosis pattern of the control cells (HL60 & leukaemia SR). (B &D) The cytograms show apoptosis pattern of compound 1c treated cells. (E) The column graph represent quantification of annexin v positive cells for compound 1c relative to control showing total, early & late apoptosis (F) The column graph represents necrosis percent in compound 1c treated cells compared to their untreated control. * P < 0.05 indicates significant differences compared with control using unpaired student t test.
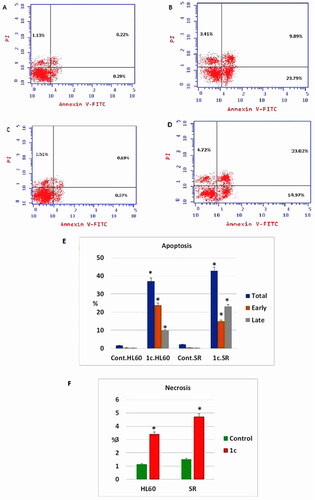
Figure 12. Effects of compound 1c on caspase 3 level in HL60 and leukaemia SR cells. Values are reported as mean SEM. * P < 0.05 indicates significant difference from the untreated control using unpaired student t test.
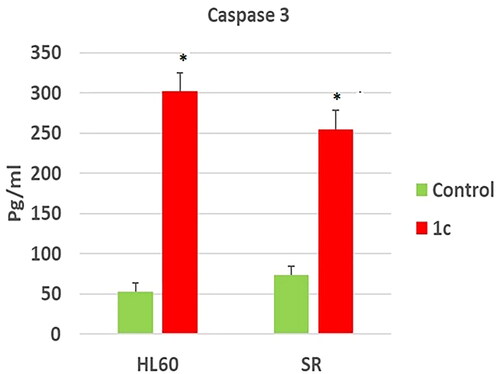
Figure 13. The effect of compound 1c on Bcl2, P53, and Bax protein levels on HL60 and leukaemia SR cells. (A) Western blotting analysis of Bcl2, P53, Bax protein expression in HL60 and leukaemia SR cells treated with compound 1c compared to their untreated cells as negative control. B- actin was used as loading control. (B) The column graph represents relative expression of Bcl2, P53, and Bax protein levels after compound 1c treatment in HL60 and leukaemia SR cell lines in comparison to their untreated controls. * significance at P < 0.05.
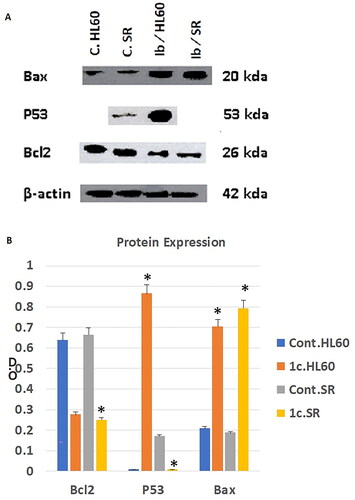
Table 3. Cytotoxic activity (IC50) of compound 1c against WI-38 cell line.
Figure 14. A) 3D structure of the docked duvelisib into the biding site of PI3Kδ (red dotted lines are non-covalent interactions); B) 2D representation of the non-covalent interactions between duvelisib and binding site amino acid residues (green dotted line: H-bonds, other coloured dotted lines: hydrophobic interactions).
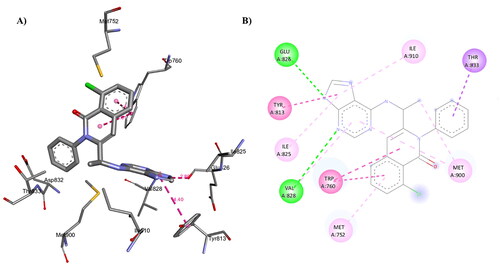
Figure 15. Binding mode of compound 1c inside the binding pocket of human PI3Kδ.
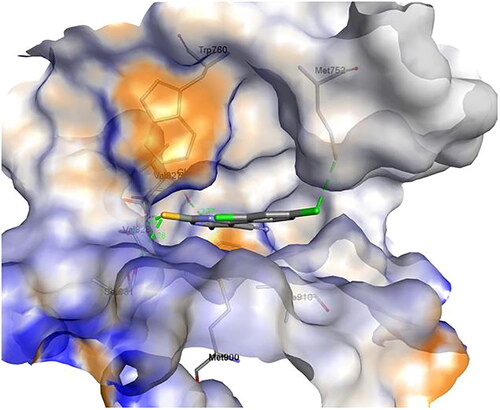
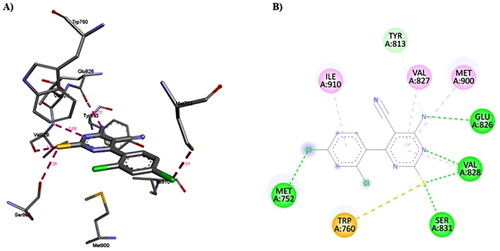
Figure 16. A) 3D structure of the docked compound 1c into the biding site of PI3Kδ (red dotted lines are H-bonds); B) 2D representation of the non-covalent interactions between 1c and binding site amino acid residues (green dotted line: H-bonds, pink dotted lines: hydrophobic interactions; orange line: π-Sulfur interaction).