
Figures & data
Figure 1. Structure of anticancer 1,2,4-oxadiazoles I–III.
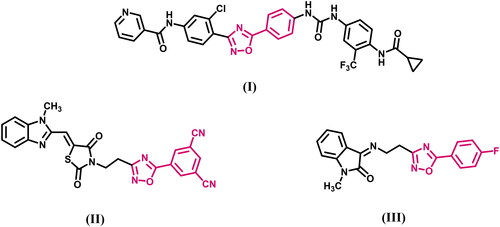
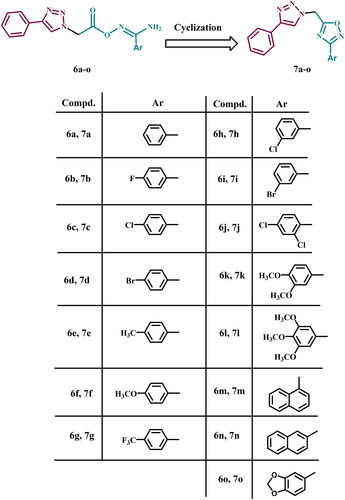
Figure 2. Structures of previously reported compounds 6a–o and newly synthesised 7a–o.
Scheme 1. Synthetic pathway of compounds 7a–o
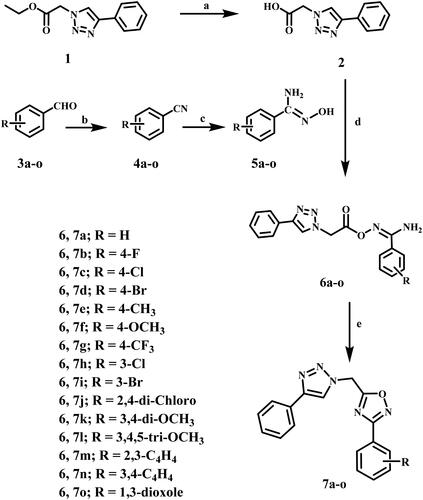
Table 1. Antiproliferative activity of compounds 7a–o and Erlotinib.
Figure 3. GI50 of compounds 7f, 7k, and 7l compared to Erlotinib.
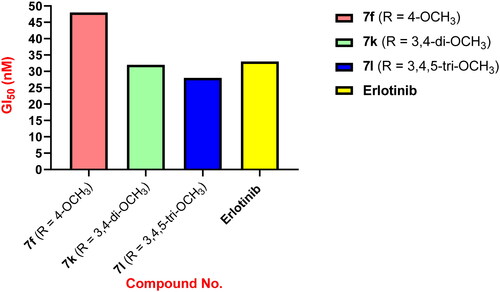
Figure 4. GI50 of compounds 7b, 7c, 7d, 7h, 7i, 7j and Erlotinib.
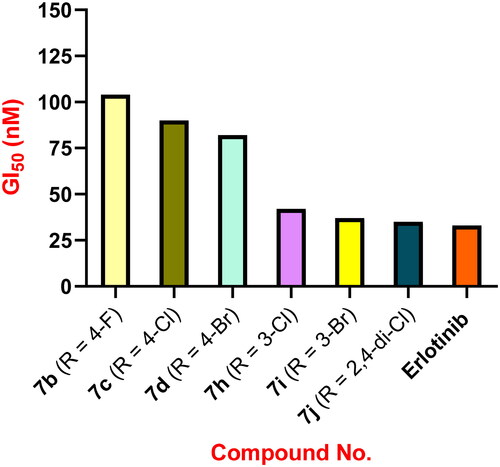
Table 2. IC50 values of compounds 7h, 7i, 7j, 7k, 7l, Erlotinib and Sorafenib against EGFR and VEGFR-2.
Table 3. Caspase-3, caspase-8, Bax, and Bcl-2 levels of compounds 7j, 7k, and 7l.
Table 4. Ligand–protein complex interactions of the tested compounds 7h, 7i, 7j, 7k, and 7l within the active site of EGFR.
Figure 5. Docking representation models of compound 7k, 7l, and Erlotinib within the binding site of EGFR (H-bond: blue dashed lines, Pi–H; green dashed lines). (A) 3D-docked model of compound 7k (cyan) showing the protein surface (grey); (B) 2D-docked model of compound 7k; (C) 3D-docked model of compound 7l (cyan) showing the protein surface (grey); (D) 2D-docked model of compound 7l; (E) 3D-docked model of compound Erlotinib (pink) showing the protein surface (grey); (F) 2D-docked model of compound Erlotinib.
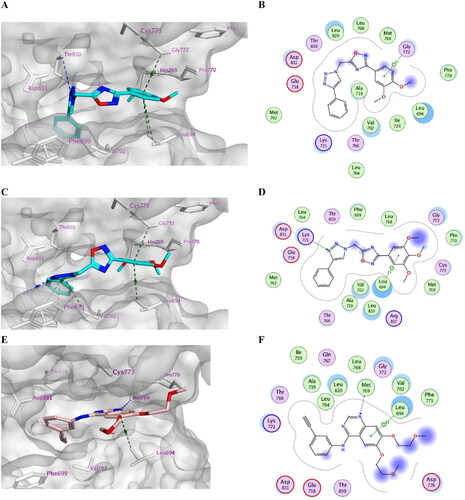
Figure 6. Docking representation model of compound 7h (cyan) aligned with compound 7i (pink) showing the protein surface (grey) of the site of EGFR (H-bond or halogen bond: blue dashed lines, Pi–H; green dashed lines).
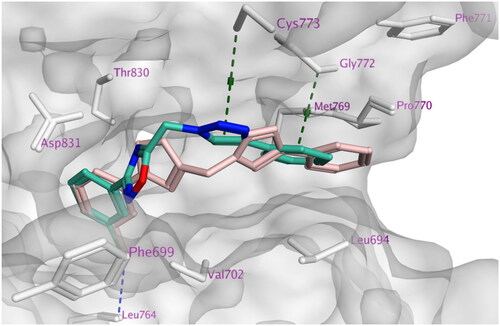
Figure 7. Docking representation model of compounds 7k and 7l within the binding site of VEGFR-2 (H-bond: blue dashed lines, Pi–H; green dashed lines). (A) 3D-docked model of compound 7k (yellow) aligned with compound 7l (cyan) showing the lipophilicity surface of active site (purple; hydrophilic, white; neutral; green; lipophilic); (B) 2D-docked model of compound 7k; (C) 2D-docked model of compound 7l.
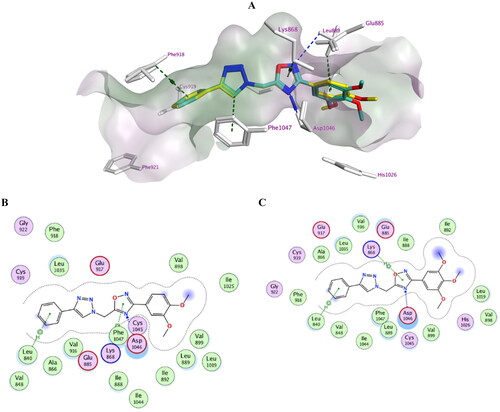
Table 5. Ligand–protein complex interactions of the tested compounds 7h, 7i, 7j, 7k, and 7l within the active site of VEGFR-2.
Figure 8. (A) Binding mode of compound 7l (cyan) to active site of EGFR showing DFG motif in purple. (B) Binding mode of compound 7l (cyan) to active site of VEGFR-2 showing DFG motif in purple.
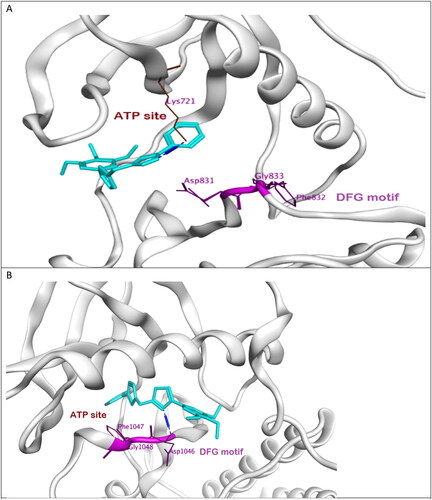
Table 6. Physicochemical and pharmacokinetic properties (Lipinski parameters) of compounds 7h, 7i, 7j, 7k, and 7l.
Table 7. ADME properties of compounds 7h, 7i, 7j, 7k, and 7l.