Figures & data
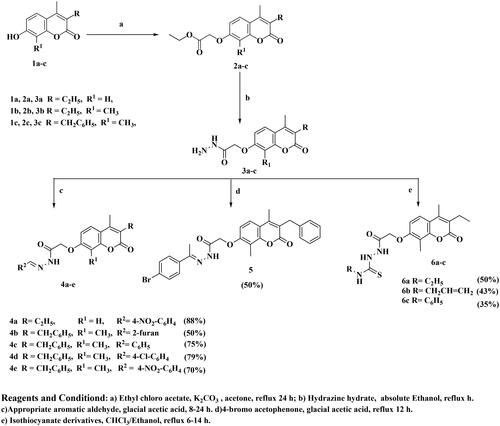
Scheme 1. Synthesis of the target compounds 4a–e, 5, and 6a–c.
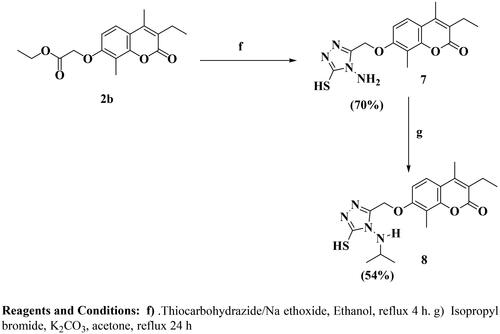
Scheme 2. Synthesis of the target compounds 7 and 8.
Scheme 3. Synthesis of the target compounds 9a–e.
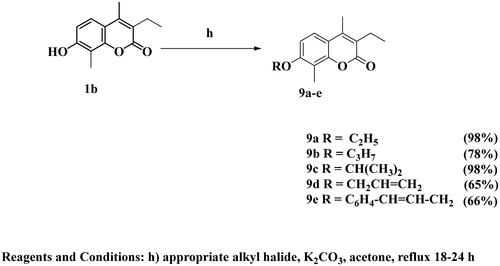
Figure 1. Some natural and synthetic coumarin derivatives with cytotoxic activity.
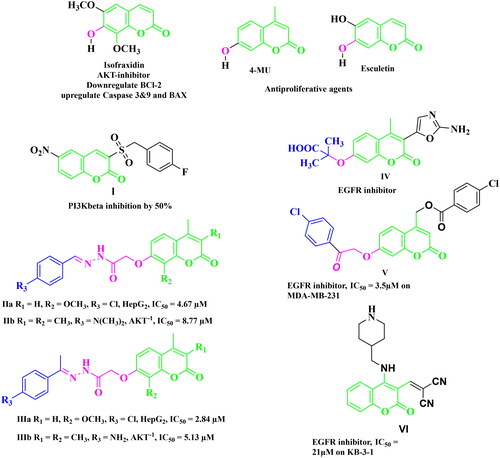
Figure 2. Design strategy of the desired compounds.
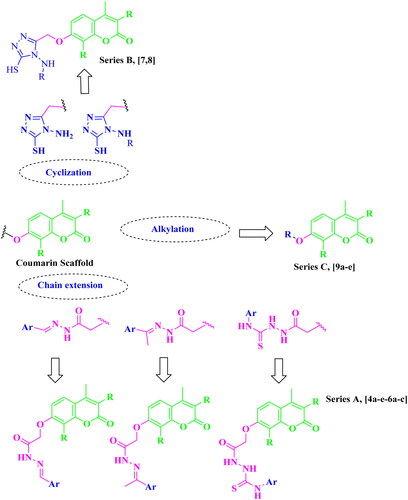
Figure 3. A diagrammatic sketch illustrating the signalling pathway of the EGFR/PI3K/AKT/mTOR and coumarin targeting retrieved by Biorender.com templates Citation29.
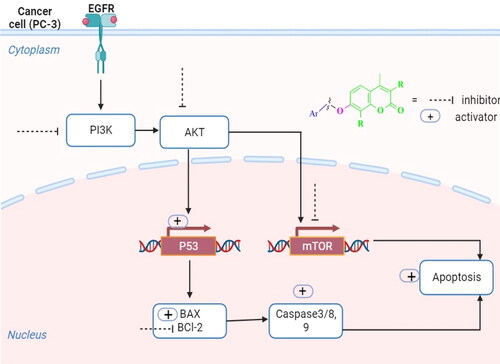
Table 1. Cytotoxicity of the tested compounds and erlotinib over MDA-MB-231 and PC-3 (IC50, µM).
Table 2. Cytotoxicity of compound 5 and erlotinib over HCT-116, HEPG-2, and HPrEC (IC50, µM).
Figure 4. (A) Graphical representation for comparison of IC50 EGFR (µM) of compounds 4a–c, 4e, 5, and erlotinib, (B) graphical representation for comparison of IC50 PI3Kβ (µM) of compounds 4a–c, 4e, 5 LY294002. Both enzymes were performed using four-dose protocol. The data are expressed as mean ± SD (n = 3 experiments), statistical analysis was performed by two-way ANOVA followed by Tukey’s post hoc test with *significant at p > 0.05, **significant at p > 0.01, ***significant at p > 0.001, and ****significant at p > 0.0001 and nsno significance.
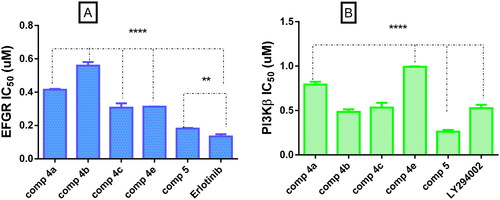
Table 3. IC50 values of PI3K isoforms of compound 5 and (IC50, µM).
Figure 5. A graph represents the effect of compound 5 on the gene expression of AKT and m-TOR compared with negative control and erlotinib. The data are expressed as mean ± SD (n = 3 experiments), statistical analysis was performed by two-way ANOVA followed by Tukey’s post hoc test with *significant at p > 0.05, **significant at p > 0.01, ***significant at p > 0.001, ****significant at p > 0.0001, and nsno significance.
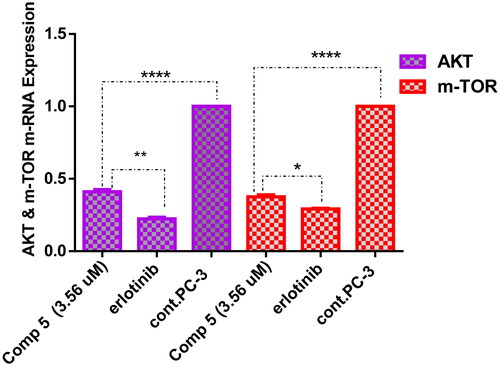
Figure 6. Cell cycle analysis of compound 5 at its IC50 on PC-3 cancer cells.
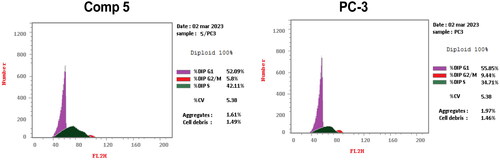
Figure 7. Graphical representation of cell cycle analysis of compound 5 at its IC50 on PC-3 cells.
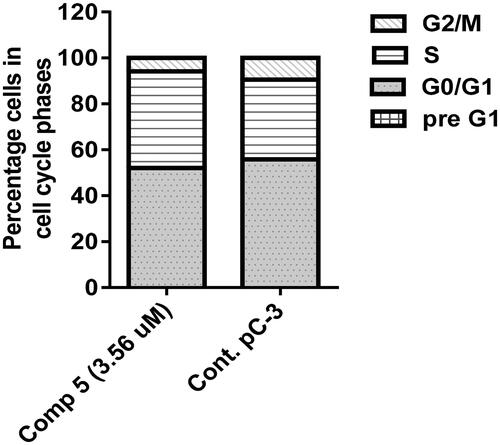
Figure 8. Annexin V/propidium iodide staining for apoptosis analysis of compound 5 at its IC50 on PC-3 cells.
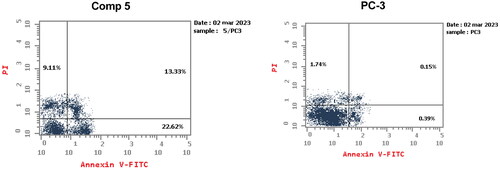
Figure 9. A graphical representation of Annexin V/propidium iodide staining for apoptosis analysis of compound 5 at its IC50 on PC-3 cells.
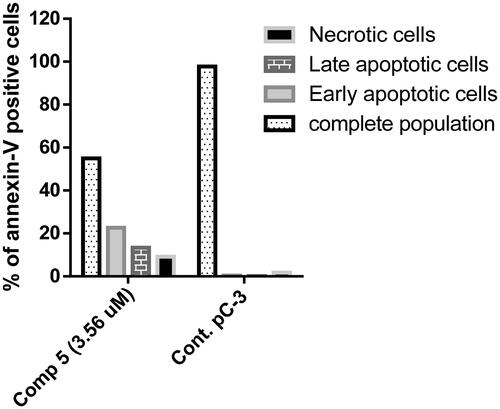
Figure 10. A graph represents the relative gene expression of (A) P53, (B) BAX, (C) BCl-2, (D) caspase 3, and (E) caspase 8 of compound 5 at its IC50 versus erlotinib and untreated PC-3. The data are expressed as mean ± SD (n = 3 experiment); statistical analysis was performed by two-way ANOVA followed by Tukey’s post hoc test with *significant at p > 0.05, **significant at p > 0.01, ***significant at p > 0.001, ****significant at p > 0.0001 and nsno significance.
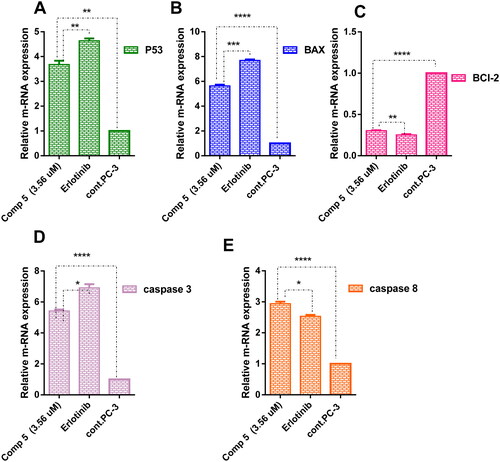
Table 4. Docking score of tested compounds representing series A, B, and C.
Figure 11. The 2D/3D interaction diagram of bioactive confirmation of erlotinib within the binding site of EGFR tyrosine kinase domain (PDB ID: 1M17). (A) The 2D interaction diagram, amino acids in contact with erlotinib are displayed as spheres. Violet spheres represent polar amino acids while green sphere represents hydrophobic amino acids. Solvent-exposed regions of erlotinib are highlighted in blue. The dotted lines represent non-bonding interactions. (B) The 3D interaction of erlotinib reveals a 41.6° dihedral angle between the phenyl ring and quinazoline, facilitating optimal interactions with Lys 721 in a pi-cation configuration, along with interactions with Met 769 and Gln 768.
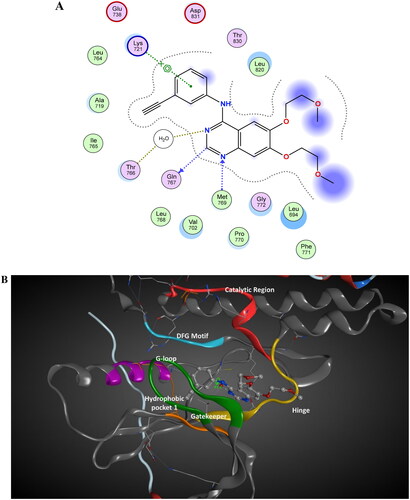
Figure 12. Schematic diagram of the interaction of series A active compounds (4a–5).
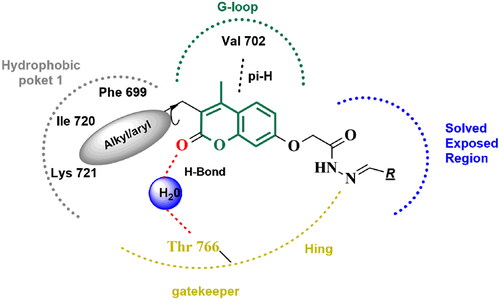
Figure 13. The 2D/3D interaction diagram of compound 5 within the binding site of EGFR tyrosine kinase domain (PDB ID: 1M17). (A) Showing the 2D interaction diagram, amino acids in contact with compound 5 are displayed as spheres. Violet spheres represent polar amino acids while green sphere represents hydrophobic amino acids. Solvent-exposed regions of compound 5 are highlighted in blue. The dotted lines represent non-bonding interactions. (B) The 3D interaction diagram of compound 5 reveals a 65.6° dihedral angle between the phenyl ring and coumarin scaffold allowing optimum 3D geometry for the coumarin ring to interact with Val 702 in G-loop and side chain of Thr766 via water bridge.
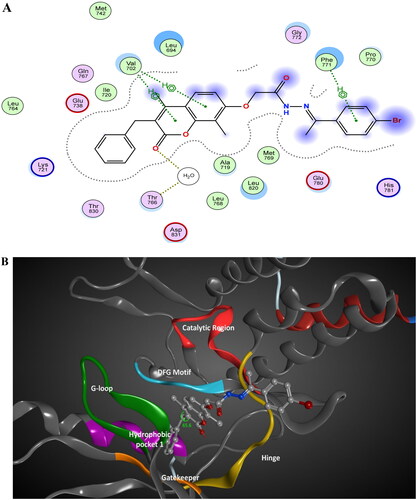
Figure 14. The 2D/3D interaction diagram of compound 5 within the binding site of PI3K kinase (PDB ID 4JPS). (A) The 2D interaction diagram, amino acids in contact with compound 5 are displayed as spheres. Violet spheres represent polar amino acids while green spheres represent hydrophobic amino acids. Solvent-exposed regions of compound 5 are highlighted in blue. The dotted lines represent non-bonding interactions. (B) The 3D interaction diagram of compound 5 with in binding site of PI3K represented as a coloured surface. The polar binding site regions are represented in magenta, hydrophobic regions in green, and solvent-exposed regions are coloured in red.
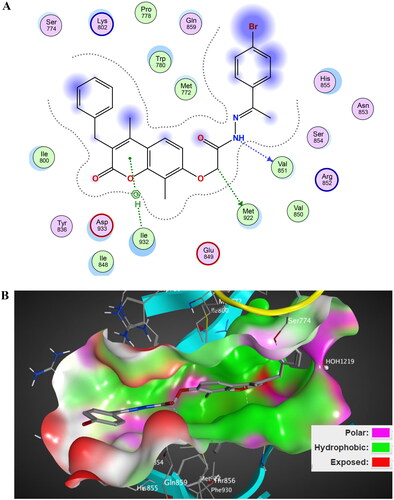
Figure 15. The 2D/3D interaction diagram of LY294002 within the binding site of PI3K kinase (PDB ID 4JPS). (A) The 2D interaction diagram, amino acids in contact with compound 5 are displayed as spheres. Violet spheres represent polar amino acids while green spheres represent hydrophobic amino acids. Solvent-exposed regions of compound 5 are highlighted in blue. The dotted lines represent non-bonding interactions. (B) The 3D interaction diagram of LY294002 within the binding site of PI3K is represented as a coloured surface. The polar binding site regions are represented in magenta, hydrophobic regions in green, and solvent-exposed regions are coloured in red.
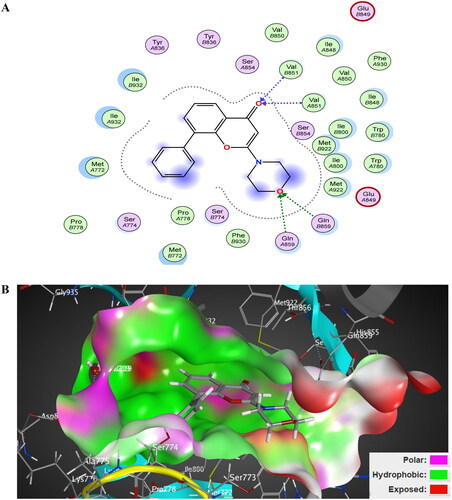
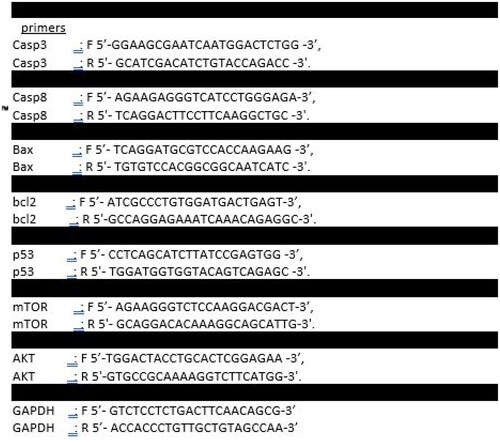
Figure 16. Primer sequences of the targeted genes.