
Figures & data
Figure 1. (A) Reported imidazole-containing drugs I-III as anticancer agentsCitation21–23, (B) Reported drugs bearing imidazole- polynuclear scaffold hybrids IV-V as anticancer agentsCitation5,Citation24,Citation25.
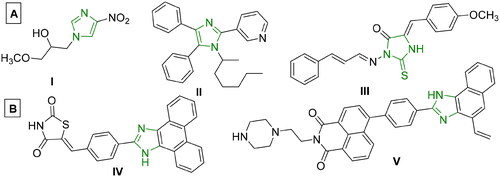
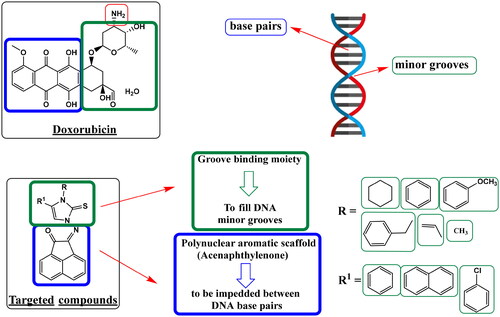
Figure 2. Work approach describes a hypothesis for designing targeted compounds based on structure features required for DNA damage through double helix intercalation and topoisomerase II inhibition, as in standard DNA intercalator Doxorubicin.
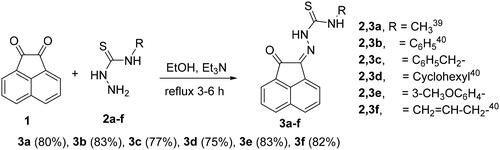
Scheme 1. Synthesis of N-substituted-2-(2-oxoacenaphthylen-1(2H)-ylidene)hydrazine-carbothioamide derivatives 3a-f.
Scheme 2. Synthesis of imidazole-2-thiones 5a-n.
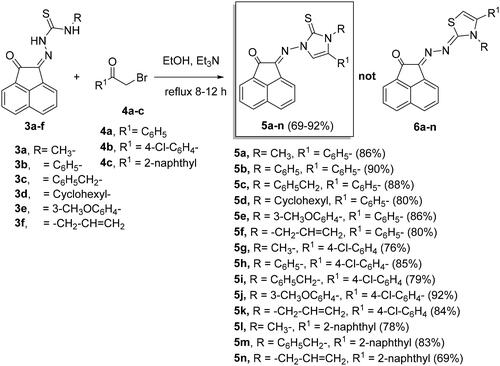
Figure 3. Fragmentation patterns A-C for mass spectra of compounds 5a-n.
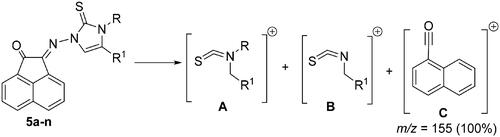
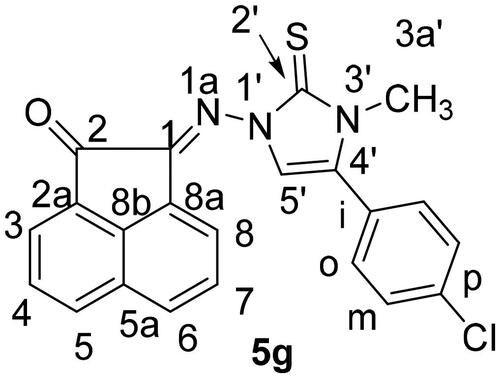
Figure 4. Distinctive carbons of compound 5 g.
Scheme 3. Mechanism describes the formation of 5a-n.
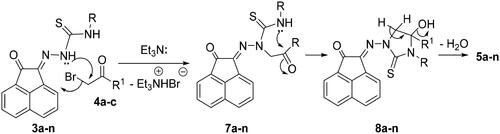
Figure 5. Schematic diagram for the fluorimetric detection of the induced DNA damage using terbium chloride (Tb3+) luminescent biosensor.
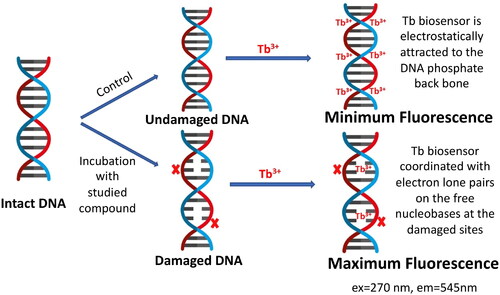
Figure 6. Tb3+ luminescence enhancement at λmax = 545 nm after excitation at λmax = 270 nm of the studied compounds compared to reference doxorubicin (DOX). Controls such as DNA-Tb3+ mixture, and Tb3+ alone are also presented.
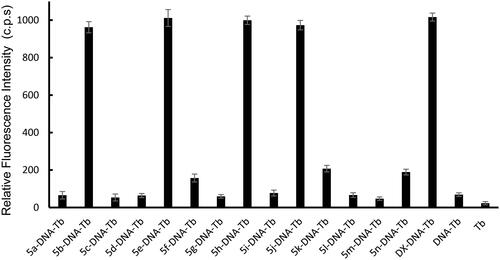
Figure 7. Effect of increasing concentration of (a) 5b, (b) 5e, (c) 5h, (d) 5j, and (e) doxorubicin (DOX) as a reference of the luminescence of Tb- ctDNA complex. The insets show the fit to the linear region of the constructed plots.
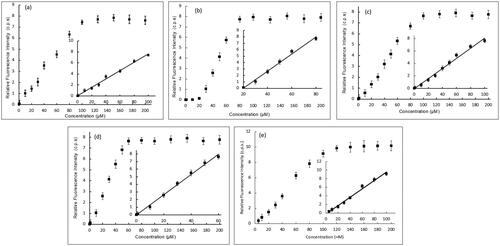
Table 1. Analytical parameters for the fluorescence measurements of 5b, 5e, 5h, 5j, and doxorubicin as a reference with ctDNA mixtures.
Figure 8. In vitro anticancer activity, IC50 (μM) of 5b, 5e, 5h, and 5j in comparison to Doxorubicin.
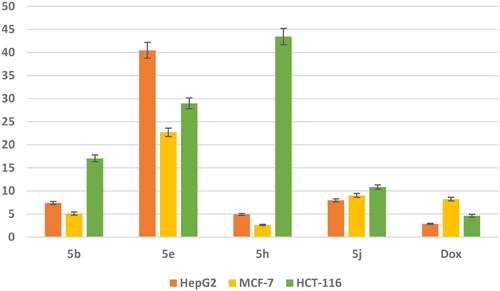
Table 2. Selectivity Index (SI) of compounds 5b, 5h, and doxorubicin against human breast adenocarcinoma (MCF-7).
Figure 9. (A) A graphical representation of apoptosis induction analysis of compounds 5b, 5h and doxorubicin as reference against MCF-7 at their IC50(μM). (B) Apoptosis induction analysis of compounds 5b, 5h, and doxorubicin as reference against MCF- 7 at their IC50 (μM).
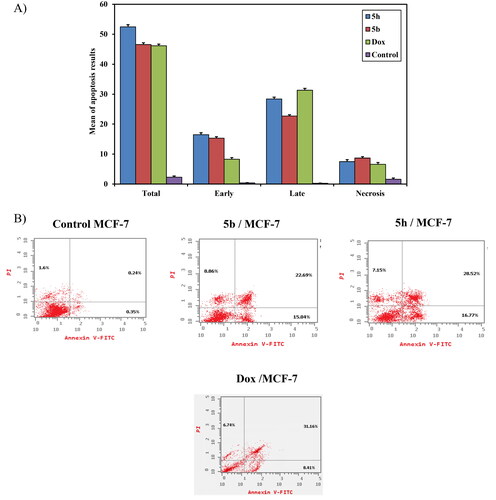
Figure 10. (A) A graphical representation of cell cycle analysis of compounds 5b, 5h, and doxorubicin as a reference against MCF-7 at their IC50 (μM). (B) Cell cycle analysis of compounds 5b, 5h, and doxorubicin as a reference against MCF-7 at their IC50 (μM).
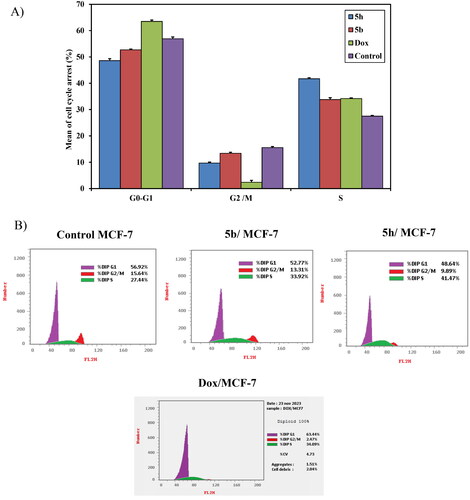
Figure 11. A graphical representation of 5b, 5h and DOX against Topo II inhibitory activity.
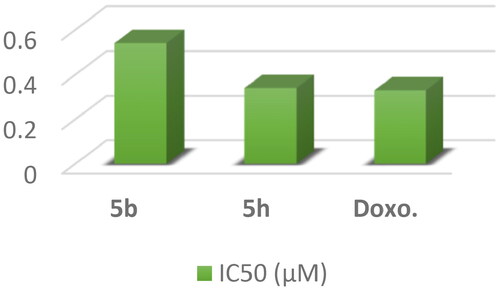
Figure 12. Structure-Activity relationship of DNA damage testing, antiproliferative activity and topoisomerase inhibitory activity for tested compounds.
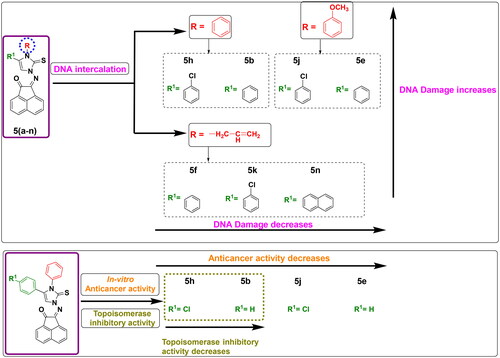
Figure 13. 3D representation of the overlay of re-docked ligand (green) to the co-crystallized ligand EVP (red) (RMSD =1.06 Å).
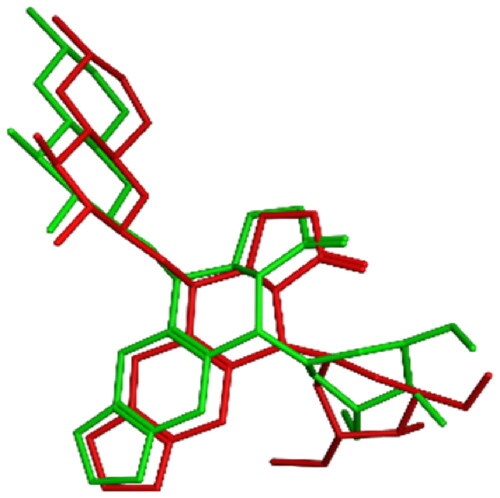
Figure 14. The binding interaction of EVP (green) at the pocket of the active site of DNA-Topo IIβ complex in 2D (left panel) and 3D representation (right panel).
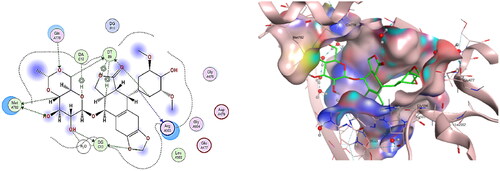
Figure 15. The binding interaction of doxorubicin (red) at the active site of DNA-Topo IIβ complex in 2D (left panel) and 3D representation (right panel).
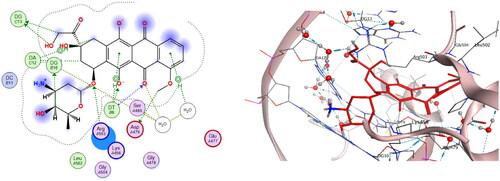
Table 3. Molecular docking scoring and interactions of tested compounds at the active site of DNA-Topo IIβ (PDB ID: 3QX3) in comparison to reference drugs EVP and DOX.
Figure 16. The binding interaction of compound 5b (blue) at the active site of DNA-Topo IIβ complex in 2D (left panel) and 3D representation (right panel).
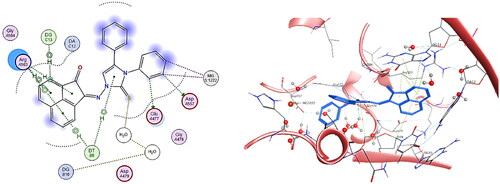
Figure 17. The binding interaction of compound 5h (yellow) at the active site of DNA-Topo IIβ complex in 2D (left panel) and 3D representation (right panel).
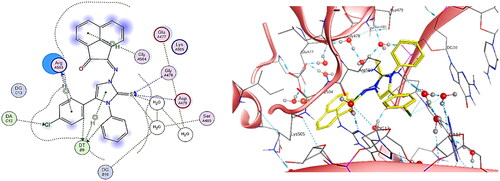
Figure 18. (A) Cartoon representation of the molecular surface of DNA-Topo IIβ complex (PDB:3QX3) showing EVP (green), 5b (blue), 5h (yellow), doxorubicin (red) in the binding pocket. (B) Focused view of the active site. (C) Transparent mode of the cartoon representation illustrating the binding pocket with the essential aminoacids and nucleotides.
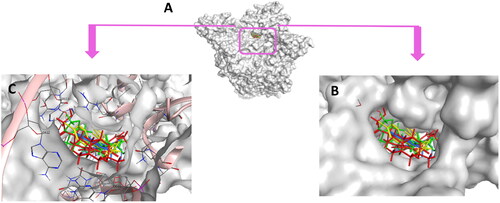
Table 4. In silico predictions of the pharmacokinetics and drug-likeness properties for 5b, 5e, 5h, and 5j.
Supplemental Material
Download PDF (11.7 MB)Data availability statement
Data set generated during and/or analysed during the current study are available from the corresponding author on reasonable request.