
Figures & data
Figure 1. Solution NMR structure of MALTIR. (A) MALTIR structure demonstrates a typical TIR-domain fold with parallel β-strands surrounded by α-helices, as labelled (α-helices, β-strands and loops are coloured in cyan, magenta and salmon, respectively). (B) Superposition of the solution NMR structures of MALTIR (this work; PDB ID: 8JZM) and MALTIR-C116A (PDB ID: 2NDH, top panel), X-ray crystal structure (PDB ID: 2Y92, middle panel) and a monomer of MALTIR higher-order assembly cryo-EM structure (PDB ID: 5UZB, bottom panel). The inset shows the corresponding colours. The orientation of the superpositions is the same as panel A. In this orientation, the stable (e.g., αA, αE and βA) and disordered (e.g., part of αB, αC and αC′) segments of MALTIR are broadly located on the left and right side of the molecule, respectively.
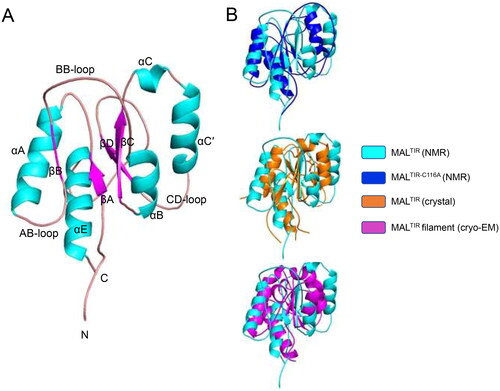
Figure 2. Turbidity assays of MALTIR in the presence of o-vanillin and its analogues. (A) o-Vanillin and its analogues. (B) MALTIR polymerisation (black line) was followed by measuring absorbance at 500 nm as a function of time with incubation at 30 °C. MALTIR at ∼87.5 µM was incubated with or without o-vanillin and its analogues at a MALTIR: compound (molar ratio) of 1:50. A representative of two independent experiments is shown. (C) o-Vanillin inhibits MALTIR filament formation in a concentration-dependent manner. MALTIR (∼90 µM) was incubated with the indicated MALTIR: o-vanillin molar ratios and turbidity analysed as in panel B. The result is typical of two independent experiments.
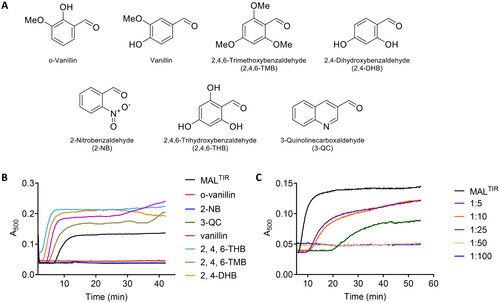
Figure 3. HSQC analysis of the concentration-dependent titration of o-vanillin. (A) The overlay of a section of the 1H-15N-HSQC spectrum of MALTIR (black) at different protein: ligand molar ratios between 1:1 (red) and 1:25 (blue). Seven different protein:ligand molar ratios (1:1, 1:2, 1:5, 1:7.5, 1:10, 1:20 and 1:25; MALTIR concentration was ∼106 µM) were tested; for simplicity, only the extreme titration points are presented. Important residues are labelled, with arrows showing the directions in which new peaks appear for each resonance. The inset shows an enlarged view of an example of slow exchange for S113. (B) Chemical-shift changes of MALTIR residues in the presence of o-vanillin (molar ratio 1:25). The dotted line represents the average chemical-shift change for these residues.
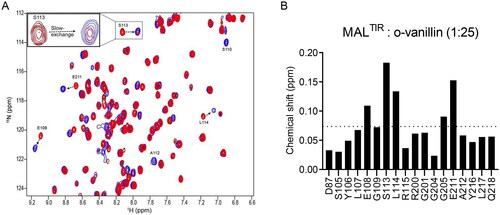
Figure 4. Intermolecular interactions between MALTIR and o-vanillin. (A) The overlay of a section of 2D projected (1H–13C) spectrum of the 3D-13C-HSQC-NOESY (aliphatic region) that shows ligand-free protein (blue) and protein: ligand at 1:20 molar ratio (pink). In the presence of o-vanillin, the K210-HɛCɛ peak is shifted downfield, as indicated with the dotted arrow. (B) The overlay of the 3D-13C-HSQC-NOESY strips of K210-HɛCɛ that shows ligand-free protein (blue) and protein: ligand at 1:20 molar ratio (pink). The strip for 13C (42.18 ppm) corresponds to the ligand-free state (left), and the strip for 13C (53.52 ppm) corresponds to the shifted peak that appears in the presence of o-vanillin (right). (C) Isotope-filtered 1H–1H NOESY spectrum. The blue coloured positive peaks provide NOE correlations between ligand protons and all protons (ligand and protein) and are labelled in red. The light green-coloured negative peaks provide NOE correlations between ligand protons only and are labelled in black. (D) The overlay of a section of the 1H-15N-HSQC spectrum of MALTIR-K158A (green), at protein: ligand molar ratios 1:1 (red) and 1:20 (blue). Several residues of MALTIR-K158A show slow exchange in the presence of o-vanillin (analogous to MALTIR), with arrows indicating the directions in which new peaks appear for each resonance. The inset shows an enlarged view of slow exchange for S113. (E) The overlay of the 1H-15N-HSQC spectrum, recorded for ligand-free MALTIR-K210A and in the presence of o-vanillin (same protein: ligand molar ratios and colour scheme as in panel D). The residues are not perturbed by o-vanillin for this mutant; S113, the most perturbed residue for MALTIR and MALTIR-K158A, is labelled as an example.
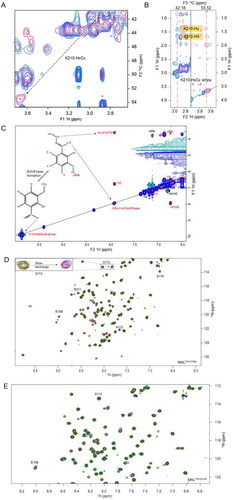
Figure 5. Intermolecular NOE-based distance restraints for binding of o-vanillin. (A) The overlay of 3D-13C-HSQC-NOESY (for the aliphatic region) spectrum recorded for the ligand-free protein (blue) and with ligand at a 1:20 molar ratio (pink). The arrow indicates a new peak along the I176-Hδ1Cδ1 strip that arises in the presence of the ligand and aligns with a proton peak (H4) of o-vanillin in the isotope filtered 1H–1H NOESY spectrum, as labelled. (B) Stick-representation (PDB ID: 8JZM) showing the distance from I176-Hδ1 to V209-Hα, V144-Hγb, K210-Hɛ, A212 and Y216, which are 3.4, 4.6, 11.5, 3.0 and 6.8 Å apart, respectively. The patch-3 residues A212 and Y216 are in the proximity of I176-Hδ1, although their intermolecular NOEs are not defined. The distances from the I176-Hδ1, V209-Hα and V144-Hγb to K210-Hɛ suggest that the orientation of the K210 side-chain may change to bring these protons in proximity to accommodate an o-vanillin molecule.
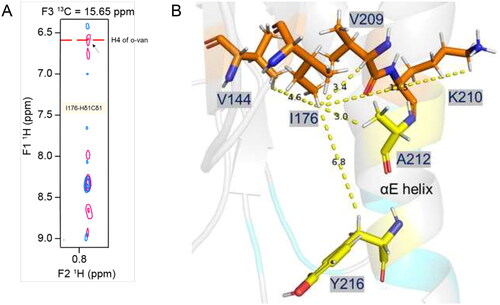
Figure 6. The functional role of reactive groups in o-vanillin. (A) Analogues of o-vanillin used to test the role of aldehyde and hydroxyl groups. (B) Turbidity assays of MALTIR (103 µM) in the presence of o-vanillin and its less reactive analogues (protein: ligand = 1:20). Representative result of two independent experiments is shown. Some turbidity increase is observed in the presence of o-vanillin, although it is clearly inhibited compared to the protein-only sample.
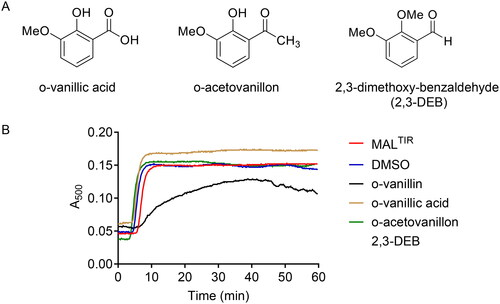
Figure 7. MALTIR residues perturbed by o-vanillin in the HSQC titration. (A) The corresponding residues are mapped onto the surface representation of MALTIR (PDB ID: 8JZM), highlighting residues 87, 105–110, 112–115 and 217–218 in cyan (patch-1); residues 200, 201, 204 and 205 in blue (patch-2); and residues 211, 212 and 216 in yellow (patch-3). The views are shown by a rotation of 700 around the y-axis. The inset shows 80% transparent surface representation and the position of three lysine residues (in stick representation and labelled) relative to the interacting patches (the orientation is different from the other two views in this panel, to highlight the positions of the three lysines). (B) The corresponding residues mapped onto the cryo-EM structure of the MALTIR filamentous assembly (PDB: 5UZB). The surface representation shows alternative subunits as green and red, respectively, along each strand. The patches 1, 2 and 3 are mapped (in the same colour scheme as in panel A) onto one of the red subunits. The black and orange boxes indicate the regions of the intra-strand interface that are affected by o-vanillin (left). Within the corresponding boxes, the perturbed residues, their interaction partners and the reactive K210 are shown in stick representation and labelled (right).
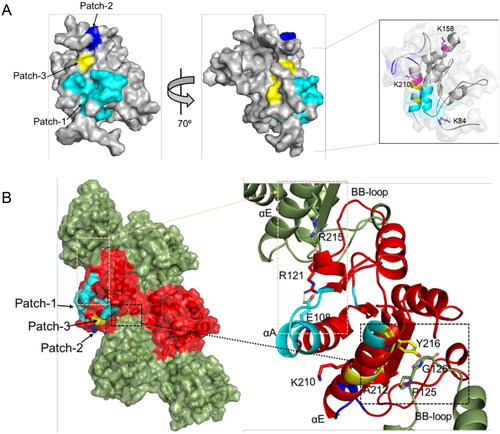
Figure 8. o-Vanillin inhibits TLR2/1 but not TLR2/6 or TLR4 signalling in a murine macrophage cell line. (A) RAW264.7 cells with an NF-κB-responsive GFP reporter gene (ELAM9) were pre-treated with o-vanillin for 1 h, and then treated with or without 10 ng/mL Pam3CSK4 for 6 h. GFP fluorescence was detected by flow cytometry. Mean fluorescence intensity (MFI) was recorded and the MFI of untreated RAW264.7 cells was subtracted to remove background cellular auto-fluorescence. Results were normalised to Pam3CSK4 treatment with no o-vanillin. (B) ELAM9 cells were incubated overnight in the presence of different concentrations of o-vanillin alone or combined with 10 ng/mL LPS or Pam3CSK4. The cells were harvested and stained with propidium iodide (PI) and the percentage of PI positive cells (% cell death) was determined by flow cytometry. (C) ELAM9 cells were pre-treated for 1 h with or without 62.5 μM o-vanillin prior to the addition of 10 ng/mL LPS, Pam2CSK4 (P2C), Pam3CSK4 (P3C) or medium alone (UT). After a further 6-h incubation the MFI was measured as per panel A. Results were normalised to LPS-treated cells without o-vanillin. For panels A to C, bars represent the mean of two independent experiments, with error bars showing the range. (D) The inhibitory activity of o-vanillin and its analogues in ELAM9 cells. After 1 h of pre-treatment with or without 62.5 µM compounds, 10 ng/mL LPS, Pam3CSK4 (P3C) or medium (UT and compound alone/DMSO control) were added. After 5–6 h of incubation, MFI was measured as per panel A. Bars depict the mean for duplicate treatments with the range indicated. These results are representative of a second independent experiment in which o-vanillin analogues were used at 125 µM.
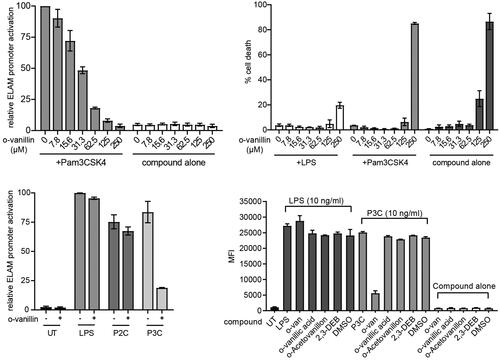
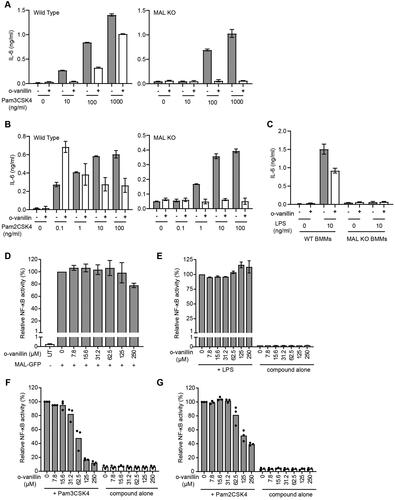
Figure 9. Inhibition of TLR2 signalling by o-vanillin in a MAL-independent fashion. (A-C) Inhibition of TLR signalling in mouse macrophages by o-vanillin does not depend on MAL. BMMs from WT or MAL-KO mice were pre-treated with 80 μM o-vanillin or 0.04% DMSO (vehicle control) for 1 h before a 6 h incubation with TLR ligands Pam3CSK4 (A), Pam2CSK4 (B) or LPS (C) at the indicated concentrations. Following incubation, medium was collected and assayed for IL-6 concentration by ELISA. Bars and error bars represent the mean and range of duplicate wells from a single representative experiment. The results of an independent replicate experiment are presented in Supplemental Figure S4 and display the same trends but are not combined with these results due to variation in absolute values. (D-G) o-Vanillin inhibits human TLR2 signalling but not the response to TLR4 or MAL overexpression. (D) Human MAL C-terminally tagged with GFP was overexpressed in HEK cells with an NF-κB-driven mScarlet-I reporter gene, in the presence or absence of o-vanillin and analysed by flow cytometry. The single cell population showing high MAL-GFP expression was selected for analysis of spontaneous NF-κB activity (Supplemental Figure S8). Results were normalised to vehicle treated control. Untreated (UT) sample was transfected with an empty vector, and assessed for the level of basal NF-κB activity. Bars and error bars represent the mean and range from 2 independent experiments. (E) TLR4 signalling was assessed in a HEK293 cell line expressing all components of the signalling pathway with an NF-κB-driven mScarlet-I reporter gene. Cells were pre-treated with o-vanillin prior to treatment with 100 ng/ml LPS, and mScarlet-I expression analysed on the whole live single cell population. Results were normalised to LPS-treated cells without o-vanillin and presented as the mean and range from 2 independent replicate experiments. (F-G) HEK293 cells expressing CD14 and with an NF-κB-driven ZsGreen reporter were transfected with human TLR2 C-terminally tagged with mScarlet-I. They were pre-treated with or without o-vanillin before stimulation with 1 μg/ml Pam3CSK4 (F) or 100 ng/ml Pam2CSK4 (G). Cells expressing low to moderate TLR2-mScarlet were selected for analysis of ZsGreen reporter expression. Results were normalised to ligand-stimulated cells without o-vanillin. Bars show the mean and individual results from 3 independent experiments are indicated.
Supplemental Material
Download PDF (1.6 MB)Data availability statement
The NMR structure and chemical shifts of MAL were deposited in the Protein Data Bank, with ID 8JZM, and the Biological Magnetic Resonance Bank, with accession number 36579, respectively.