
Figures & data
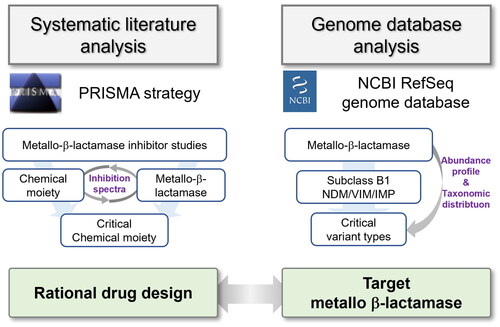
Figure 1. PRISMA (Preferred Reporting Items for Systematic Review and Meta-Analysis) flow diagram illustrating the study selection process for MBLs and MBLIs.
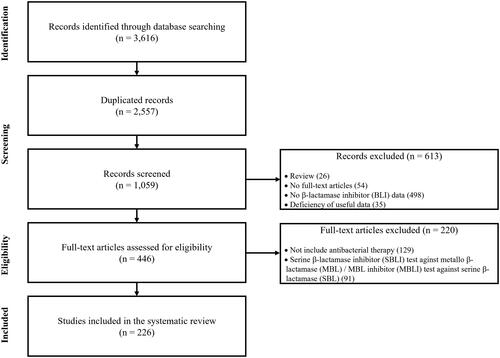
Figure 2. The chemical structures of the chemical moieties incorporated in MBLIs.
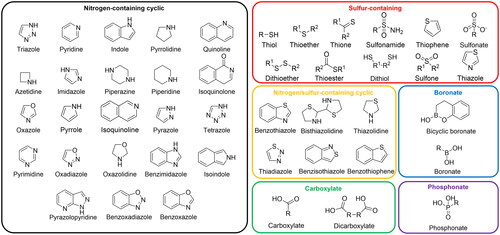
Figure 3. Chemical moieties of MBLIs and their target MBLs in the systematic literature analysis. (A) Composition of MBLIs categorised by the classification of inhibitor types and chemical moieties, and composition of MBLs according to subclasses (B1, B2, and B3) and families such as NDM; (B) Pairs of chemical moieties and inhibited MBL variant types in the literatures were counted as cases and their counted amounts were displayed as a heatmap and bar charts, based on MBL variant types used for targets of efficacious MBLIs and chemical moieties of effective MBLIs.
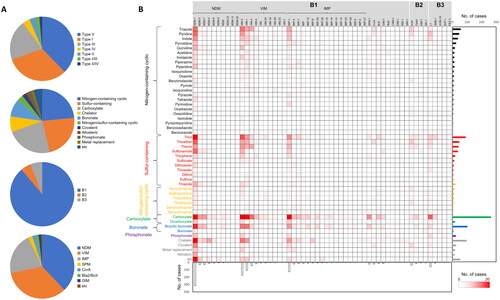
Figure 4. Abundance profiles of MBL families deposited in the NCBI RefSeq database according to their respective host genera. (A) The taxonomic distribution and abundance of MBLs at the genus and family levels. A total of 81 genera were observed as carriers of MBLs, and their families were displayed above the genus names. The phylogenetic tree of MBLs was constructed based on all MBL protein sequences retrieved from Comprehensive Antibiotic Resistance Database using the Maximum-Likelihood method with 500 bootstrap repetitions. The clustered group of protein sequences in the tree was assigned to a specific MBL clade, with the majority aligning with the classification of MBL families. The horizontal length of an isosceles triangle symbol reflects the proportion of the collapsed variant types’ number. Each subclass of MBLs is differentiated by a specific colour label (red, subclass B1; yellow, subclass B2; blue, subclass B3). Bar charts represent the abundance of each MBL family. Major MBL families (more than 100 proteins) are highlighted with red labels; (B) Taxonomic compositions of the MBL families.
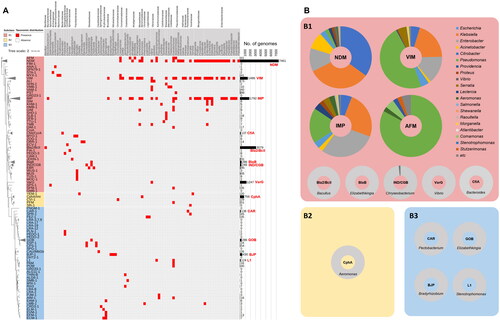
Figure 5. Abundance profiles, phylogeny, polymorphisms, and taxonomical compositions of NDM variant types deposited in the NCBI RefSeq database. (A) Abundance profiles, phylogeny, and polymorphisms of NDM variant types. The binary chart displays distribution of polymorphic residues across all NDM variant types. Heat map exhibits the taxonomic distribution of NDM proteins at the genus levels. Abundance of each variant type was displayed using a bar chart. The phylogenetic tree of NDM proteins was constructed based on all of NDM protein sequences retrieved from Comprehensive Antibiotic Resistance Database using the Maximum-Likelihood method with 500 bootstrap repetitions. NDM-1, the most abundant and most prevalent NDM variant type, was selected as the reference protein for comparison of polymorphic residues. Conserved and mutated polymorphic residues of other NDM proteins except for signal sequence were displayed as empty and filled circle, respectively. The actual amino acid residue of mutated site in each NDM family protein was represented in the circles with white letters. A total of 29 genera were observed to contain NDM variant types, and were utilised for assess their distribution across the genera in heat map. Bar charts represent the abundance of each NDM variant types. Major NDM families (more than 40 proteins) are highlighted with red labels; (B) Shannon diversity indices of each amino acid residue of all NDM variant types deposited in the NCBI RefSeq database. (C) Taxonomic compositions of the major NDM variant types.
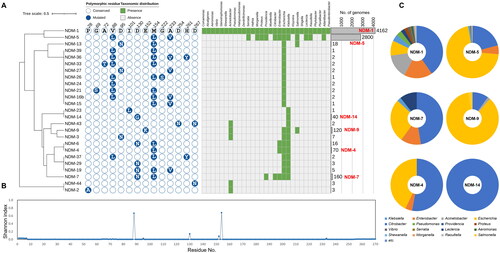
Figure 6. Abundance profiles, phylogeny, polymorphisms, and taxonomical compositions of VIM variant types deposited in the NCBI RefSeq database. (A) Abundance profiles, phylogeny, and polymorphisms of VIM variant types. The binary chart displays distribution of polymorphic residues across all VIM variant types. Heat map exhibits the taxonomic distribution of VIM proteins at the genus levels. Abundance of each variant type was displayed using a bar chart. The phylogenetic tree of VIM proteins was constructed based on all of VIM protein sequences retrieved from Comprehensive Antibiotic Resistance Database using the Maximum-Likelihood method with 500 bootstrap repetitions. VIM-2, the most abundant and most prevalent VIM variant type, was selected as the reference protein for comparison of polymorphic residues. Conserved and mutated polymorphic residues of other VIM proteins except for signal sequence were displayed as empty and filled circle, respectively. The actual amino acid residue of mutated site in each VIM family protein was represented in the circles with white letters. A total of 27 genera were observed to contain VIM variant types, and were utilised for assess their distribution across the genera in heat map. Bar charts represent the abundance of each VIM variant types. Major VIM families (more than 38 proteins) are highlighted with red labels; (B) Shannon diversity indices of each amino acid residue of all VIM variant types deposited in the NCBI RefSeq database. (C) Taxonomic compositions of the major VIM variant types.
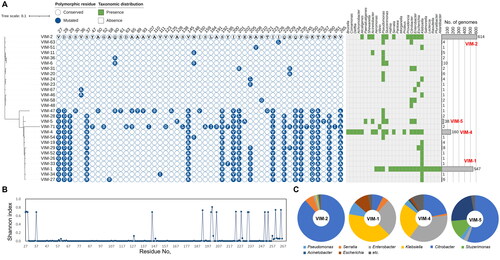
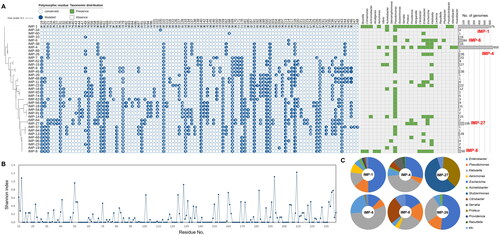
Figure 7. Abundance profiles, phylogeny, polymorphisms, and taxonomical compositions of IMP variant types deposited in the NCBI RefSeq database. (A) Abundance profiles, phylogeny, and polymorphisms of IMP variant types. The binary chart displays distribution of polymorphic residues across all IMP variant types. Heat map exhibits the taxonomic distribution of IMP proteins at the genus levels. Abundance of each variant type was displayed using a bar chart. The phylogenetic tree of IMP proteins was constructed based on all of IMP protein sequences retrieved from Comprehensive Antibiotic Resistance Database using the Maximum-Likelihood method with 500 bootstrap repetitions. IMP-1, the most abundant and most prevalent IMP variant type, was selected as the reference protein for comparison of polymorphic residues. Conserved and mutated polymorphic residues of other IMP proteins except for signal sequence were displayed as empty and filled circle, respectively. The actual amino acid residue of mutated site in each IMP family protein was represented in the circles with white letters. A total of 24 genera were observed to contain IMP variant types, and were utilised for assess their distribution across the genera in heat map. Bar charts represent the abundance of each IMP variant types. Major IMP families (more than 50 proteins) are highlighted with red labels; (B) Shannon diversity indices of each amino acid residue of all IMP variant types deposited in the NCBI RefSeq database. (C) Taxonomic compositions of five major IMP variant types and IMP-26.
Supplemental Material
Download MS Excel (42.3 KB)Data availability
None.