
Figures & data
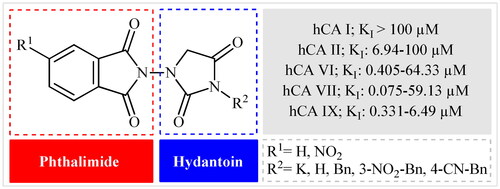
Figure 1. (a) General structure of furagin derivatives developed by our group as isoform-selective CAIs; (b) selected examples of phthalimide-based CAIs.
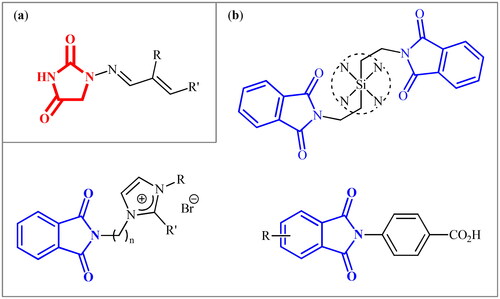
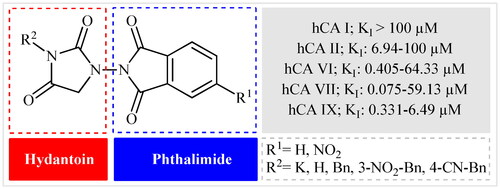
Figure 2. General structure of phthalimide–hydantoin hybrids investigated in the paper.
Scheme 1. Reagents and conditions: (i) ClCO2Et (1 equiv.), 0–20 °C, 4 h, 31%; (ii) 1-aminohydantoin hydrochloride (1 equiv.), K2CO3 (2 equiv.), 100 °C, 20 h; (iii) H2O/HCO2H (10:1), 70 °C, 2 h; (iv) H2O/HCO2H (10:1), 50 °C, 30 min; (v) (a) K2CO3, DMF, 100 °C, 1.5 h; (b) Bn-Br (1.5 equiv.), DMSO, 100 °C, 5 h.
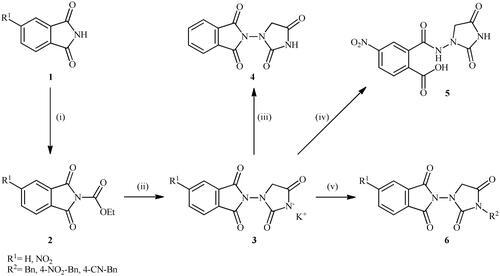
Table 1. Inhibition data of human CA I, II, VI, VII, and IX with phthalimide–hydantoin hybrids (3–6) and the reference drug (AAZ) by a stopped-flow CO2 hydrase assay [Citation16].
Figure 3. Predicted binding mode of ligands 3a (cyan) and 3b (orange) within the human: (A) CA II, (B) CA VI, (C) CA VII, and (D) CA IX active site. H-bonds and π–π stacking interactions are represented as black and cyan dashed lines, respectively.
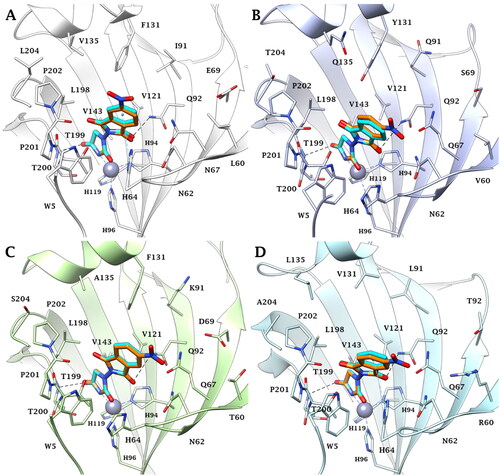
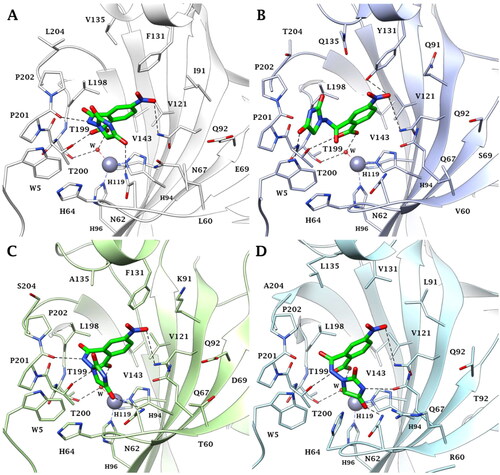
Figure 4. Predicted binding mode of ligand 5 (green) within the human: (A) CA II, (B) CA VI, (C) CA VII, and (D) CA IX active site. H-bonds and π–π stacking interactions are represented as black and cyan dashed lines, respectively.
Data availability statement
Additional data may be requested from the authors.