
Figures & data
Figure 1. Chemical structures and HO inhibitory activity in spleen and brain microsomal fractions of tested compounds.
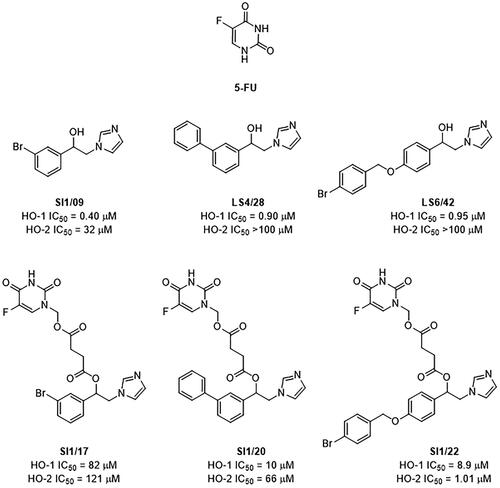
Table 1. Time course of HCT116 cell viability after treatment with 5 µM of the different drugs at different times.
Figure 2. Flow cytometry analysis of the cell cycle phase distribution of HCT116 cells after 72 h incubation with 5 μM SI1/22 or LS6/42. Hypotonic propidium iodide staining was used to evaluate DNA content as described in Methods employing Flowing software.
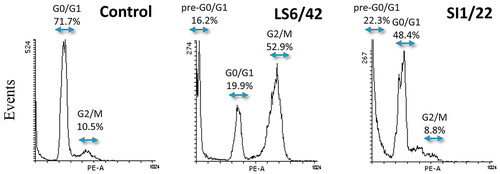
Figure 3. Effect of 5-FU, HO-1 inhibitors, hybrids, and combo treatment on HCT116 cell viability and morphology. (A) Evaluation of cell viability by MTT assay after 72 h of treatment using different concentrations of the drugs. The results represent the mean ± SD of almost three separate experiments done in triplicate. Significant vs untreated control cells: *p < 0.05; **p < 0.01; ***p < 0.001. (B) Representative images of HCT116 cells after 72 h of treatment with 15 µM of the compounds. Cells were visualised under a light microscope (200× magnification) and the pictures were acquired by IM50 Leica Software (Leika Microsystems, Wetzlar, Germany).
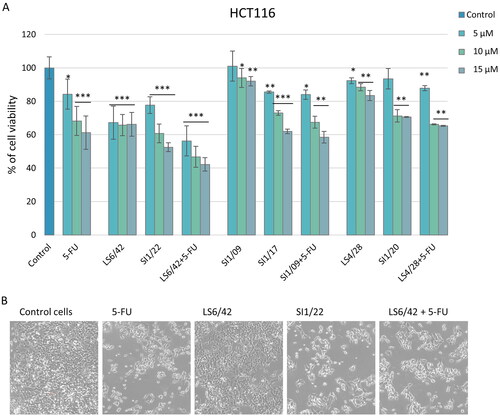
Table 2. Predicted lipophilicity/permeability and experimental antiproliferative effects in HCT116 cells of hybrids.
Table 3. Inhibition of HO-1 enzymatic activity in HCT116 treated cells with LS6/42 and SI1/22.
Figure 4. Effect of 5-FU, HO-1 inhibitors, hybrids, and combo treatment on oxidative stress. Assessment of ROS levels in HCT116 cells treated with 15 µM of tested drugs for 3 h; the images were acquired under a fluorescence microscope at 200 x magnification.
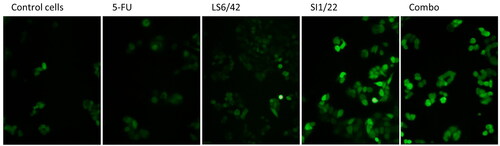
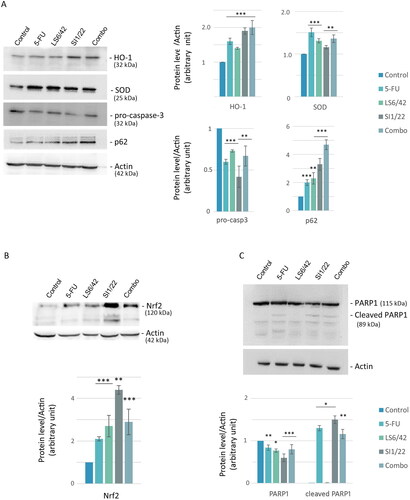
Figure 5. Analysis of apoptosis and autophagy-related proteins. Representative images and relative densitometric analysis of western blotting against different proteins. HO-1, SOD, pro-caspase-3, p62 (A) and PARP (C) protein expression levels were evaluated after 72 h of treatment, Nrf2 (B) protein after 48 h. The histograms are related to relative intensities over actin. *p < 0.05; **p < 0.01; ***p < 0.001 vs untreated cells (control).
Data availability statement
The data that support this study are available from the corresponding authors upon reasonable request.