
Figures & data
Scheme 1. Reagents and conditions: (a) appropriate phenylalaninol derivative, acetonitrile, rt; (b) NaN3, EtOH, reflux.
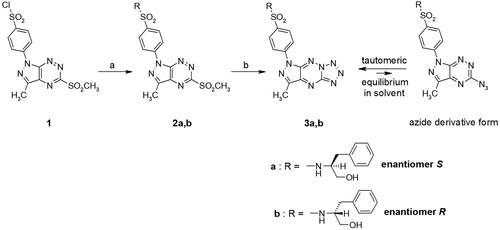
Figure 1. Viability of MCF-7 (A), MDA-MB-231 (B) breast cancer cells, and MCF-10A (C) normal breast cells incubated for 24 h with different concentrations of 2a, 2b and cisplatin. Mean values ± SD from three independent experiment (n = 3) done in duplicate are presented.
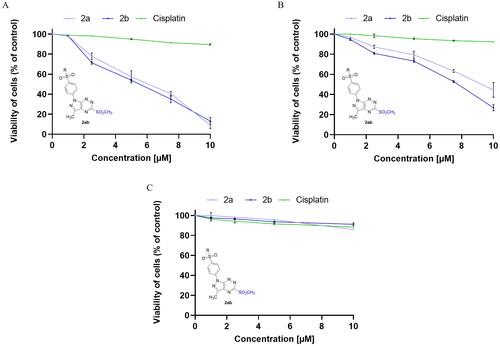
Figure 2. Viability of MCF-7 (A), MDA-MB-231 (B) breast cancer cells, and MCF-10A (C) normal breast cells incubated for 24 h with different concentrations of 3a, 3b and cisplatin. Mean values ± SD from three independent experiment (n = 3) done in duplicate are presented.
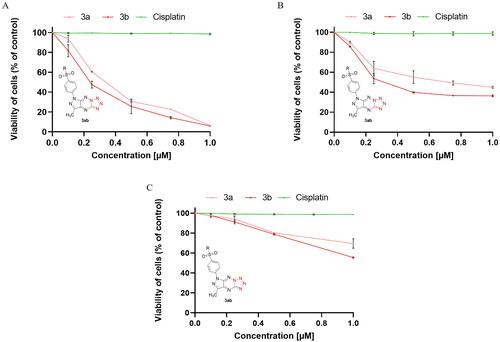
Table 1. The cytotoxic activity of new derivatives of pyrazolo[4,3-e][1,2,4]triazine.
Figure 3. Flow cytometric analysis of induction of apoptosis in MCF-7 (A) and MDA-MB-231 (B) breast cancer cells incubated for 24 h with 2b, 3b and cisplatin (0.25 μM and 0.5 μM) stained with annexin V-FITC and propidium iodide. Mean percentage values from three independent experiments done in duplicate are presented. *p < 0.05 vs. control group and ***p < 0.001 vs. control group.
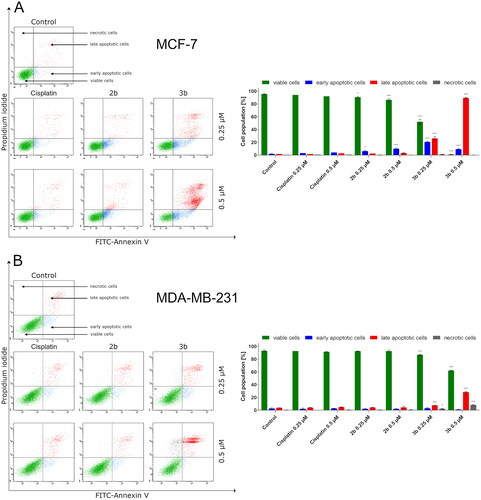
Figure 4. Flow cytometric analysis of ROS induction in MCF-7 (A) and MDA-MB-231 (B) breast cancer cells incubated for 24 h with 3b and cisplatin (0.25 μM and 0.5 μM). Mean percentage values from three independent experiments done in duplicate are presented. *p < 0.05 vs. control group, **p < 0.01 vs. control group, ***p < 0.001 vs. control group.
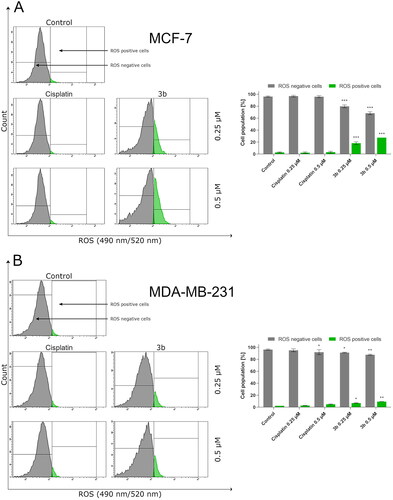
Figure 5. Anti-NF-κB antibody flow cytometric analysis of MCF-7 (A) and MDA-MB-231 (B) breast cancer cells compared to a negative control cell after 24 h of incubation with 3b and cisplatin (0.25 μM and 0.5 μM). Mean percentage values from three independent experiments done in duplicate are presented. ***p < 0.001 vs. control group.
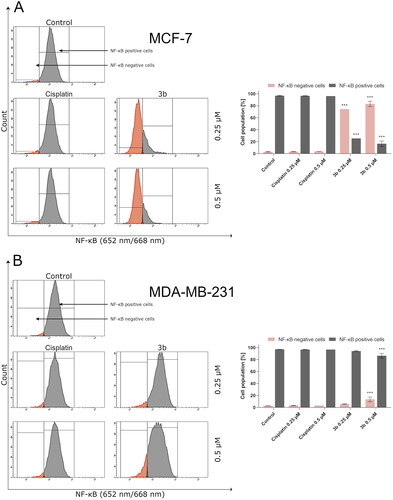
Figure 6. Anti-Bax antibody flow cytometric analysis of MCF-7 (A) and MDA-MB-231 (B) breast cancer cells compared to a negative control cell after 24 h of incubation with 3b and cisplatin (0.25 μM and 0.5 μM). Mean percentage values from three independent experiments done in duplicate are presented. ***p < 0.001 vs. control group.
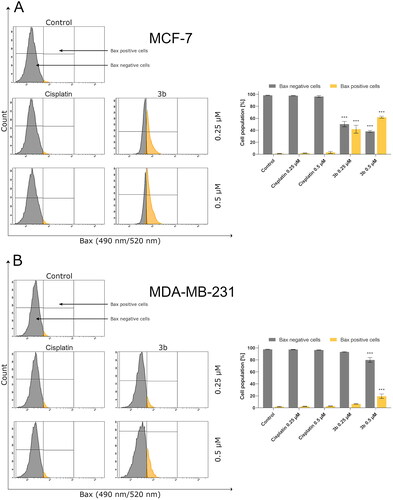
Figure 7. Anti-p53 antibody flow cytometric analysis of MCF-7 (A) and MDA-MB-231 (B) breast cancer cells compared to a negative control cell after 24 h of incubation with 3b and cisplatin (0.25 μM and 0.5 μM). Mean percentage values from three independent experiments done in duplicate are presented. ***p < 0.001 vs. control group.
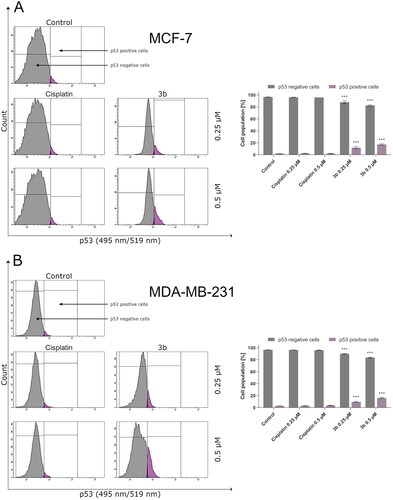
Figure 8. The activity of caspase 10 in MCF-7 (A) and MDA-MB-231 (B) breast cancer cells incubated with 3b (0.25 μM and 0.5 μM) in the absence and presence of Z-VAD-FMK (100 μM) for 24 h. Mean percentage values from three independent experiments done in duplicate are presented. ***p < 0.001 vs. control group.
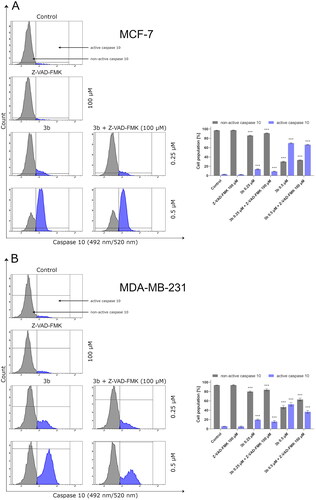
Figure 9. The activity of caspase 9 in MCF-7 (A) and MDA-MB-231 (B) breast cancer cells incubated with 3b (0.25 μM and 0.5 μM) in the absence and presence of Z-VAD-FMK (100 μM) for 24 h. Mean percentage values from three independent experiments done in duplicate are presented. ***p < 0.001 vs. control group.
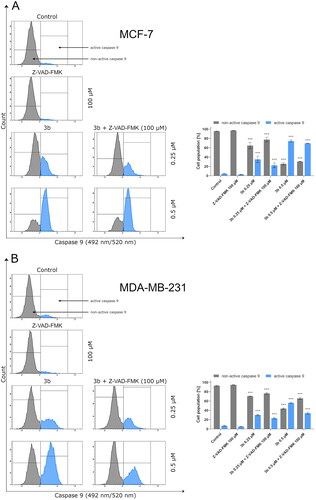
Figure 10. The activity of caspase 3/7 in MCF-7 (A) and MDA-MB-231 (B) breast cancer cells incubated with 3b (0.25 μM and 0.5 μM) in the absence and presence of Z-VAD-FMK (100 μM) for 24 h. Mean percentage values from three independent experiments done in duplicate are presented. ***p < 0.001 vs. control group.
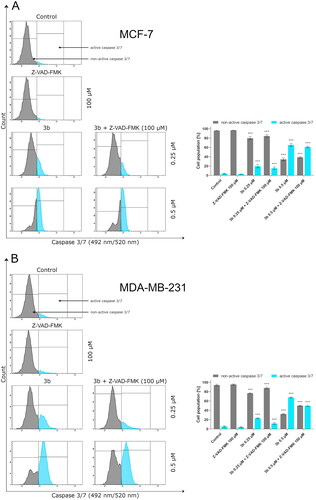
Figure 11. Flow cytometric analysis of autophagy induction in MCF-7 (A) and MDA-MB-231 (B) breast cancer cells incubated with 3b (0.25 μM and 0.5 μM in the absence or presence of 3-MA (5 mM)). Mean percentage values from three independent experiments done in duplicate are presented. *p < 0.05 vs. control group, ***p < 0.001 vs. control group.
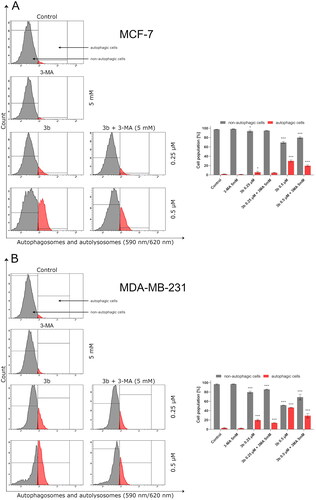
Figure 12. Anti-mTOR antibody flow cytometric analysis of MCF-7 (A) and MDA-MB-231 (B) breast cancer cells compared to a negative control cell after 24 h of incubation with 3b and cisplatin (0.25 μM and 0.5 μM). Mean percentage values from three independent experiments done in duplicate are presented. *p < 0.05 vs. control group, ***p < 0.001 vs. control group.
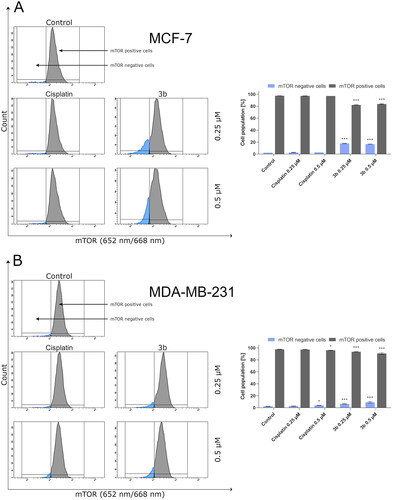
Figure 13. Anti-beclin-1 antibody flow cytometric analysis of MCF-7 (A) and MDA-MB-231 (B) breast cancer cells compared to a negative control cell after 24 h of incubation with 3b and cisplatin (0.25 μM and 0.5 μM). Mean percentage values from three independent experiments done in duplicate are presented. *p < 0.05 vs. control group, ***p < 0.001 vs. control group.
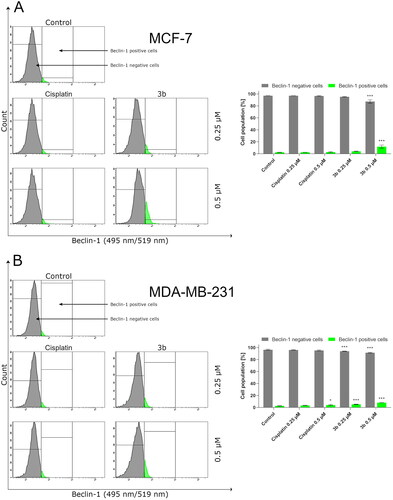
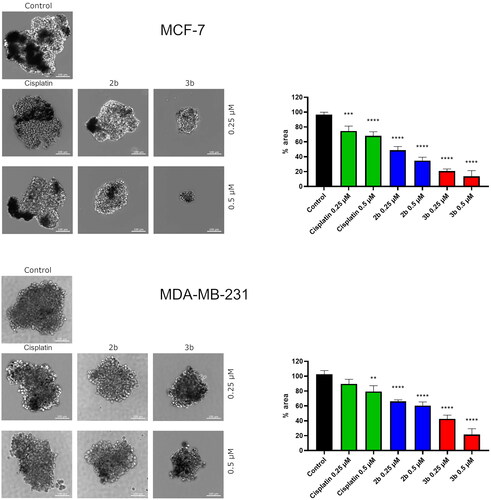
Figure 14. Microscopy images of cell invasion of spheroids incubated for 24 h with 2b, 3b and cisplatin (0.25 μM and 0.5 μM). Representative photographs are shown; scale bar: 100 μm. Microscopy images of cell invasion of spheroids incubated for 24 h with 2b, 3b and cisplatin (0.25 μM and 0.5 μM). Representative photographs are shown; scale bar: 100 μm. **p < 0.01 vs. control group, ***p < 0.001 vs. control group, ****p < 0.0001 vs. control group.
Supplemental Material
Download PDF (490.7 KB)Data availability statement
Department of Synthesis and Technology of Drugs, Medical University of Bialystok, Kilinskiego 1, 15-089 Bialystok, Poland.