
Figures & data
Table 1. Model inputs for the base case analysis.
Table 2. Base case analysis: public health and economic impact of COVID-19 vaccines.
Figure 1. a estimated median number of Covid-19 cases prevented per 1,000,000 population as of September 2021; b scatterplot of estimated median number of COVID-19 cases prevented per 1,000,000 population and COVID-19 vaccine uptake as of September 2021.
1a Note: 215 countries/territories with available clinical input data were included in the base-case analysis. Categories were defined based on Fisher’s natural breaks. Countries shaded gray had no data available.
1b Note: Seychelles (cases averted per million population: 466,111; vaccine uptake: 71.9%), Gibraltar (0; 117.6%), and Mongolia (326,534; 64.0%) were removed from the scatter plot to adjust the visualization legend.
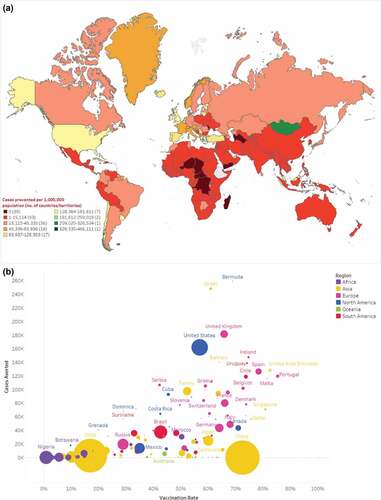
Figure 2. Estimated median cost savings (million, 2021 USD) through averted direct outpatient costs as of September 2021.
Note: 215 countries/territories with available clinical and outpatient cost data were included in the base-case analysis. Categories were defined based on Fisher’s natural breaks. Countries shaded gray had no data available.
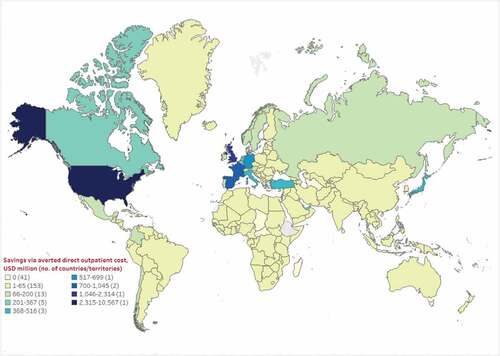
Figure 3. Estimated median cost savings (million, 2021 USD) through averted productivity loss as of September 2021.
Note: 202 countries/territories with available clinical and labor participation/income data were included in the base-case analysis. Categories were defined based on Fisher’s natural breaks. Countries shaded gray had no data available.
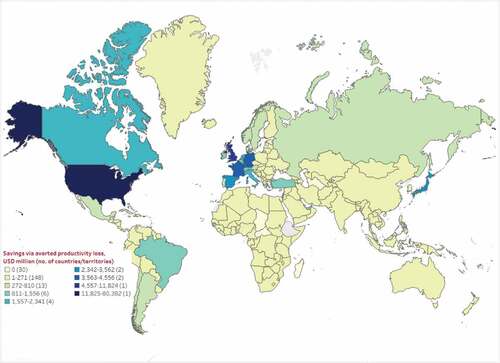
Table 3. Scenario analysis: global impact of COVID-19 vaccines on hospitalization and costs.
Supplemental material