
Figures & data
Table 1. Effect of VMV strategy on national COVID-19 vaccine coverage.
Figure 1. Proportion of population before and after VMV strategy who received a single dose of COVID-19 vaccine.
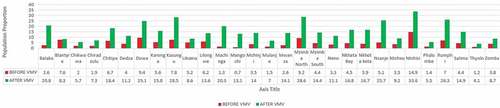
Table 2. Comparison of mean doses of COVID-19 vaccine across all 29 districts in four different phases.
Figure 2. Monthly proportion of the COVID-19 vaccine, out of the total consumed doses.
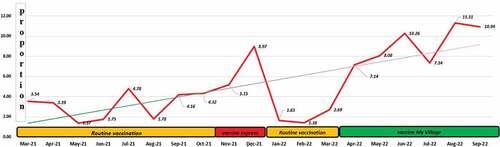
Table 3. A comparison of mean doses of the COVID-19 vaccine between VMV versus RCV-1, CVE, and RCV-2.