
Figures & data
Table 1. Summary of demographic characteristics for the study participants.
Figure 1. Transformed titre ordinal score mapped to the original titre measurement at day 0 for H1N1 virus strain (sub-figure A), H3N2 virus strain (sub-figure B), and B1 virus strain (sub-figure C) in vaccinated and non-vaccinated groups, respectively. Overall vaccine response scores at day 0 (sub-figures D and E) in vaccinated and non-vaccinated groups, respectively. The calculated response score provided informative visualization that clearly shows higher scores and better seroprotection among previously vaccinated participants.
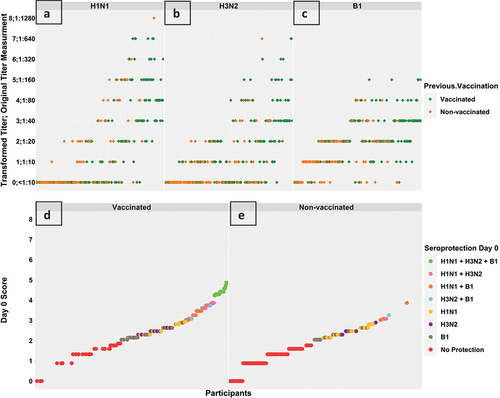
Table 2. Summary of baseline immunogenicity for the study participants. Statistical tests are used to inspect the differences between the vaccinated and non-vaccinated groups; the Mann-Whitney test compares the mean ranks of the transformed titer ordinal scores, the Chi-squared examines the differences between the number of seroprotected participants, and the Welch two Sample t-test compares the mean of the overall vaccine response score.
Table 3. Summary of baseline seroprotection stratified by age groups of participants.
Figure 2. Titre response scores at day 0, day 7, and day 90 against the H1N1 virus strain (sub-figure A), H3N2 virus strain (sub-figure B), and B1 virus strain (sub-figure C) in vaccinated and non-vaccinated groups, respectively. The box plots in subfigure a show an increase in H1N1 score among both groups at day 7, then the median score of the vaccinated group slightly decreased at day 90; more participants from the non-vaccinated group showed an increase in score and the median score of the non-vaccinated group increased further at day 90. The box plots in subfigure B shows a similar response pattern for H3N2 response but median scores for the vaccinated group were equal at day 7 and day 90. The box plots in subfigure C shows an increase in the score at day 7 and day 90 in both groups.
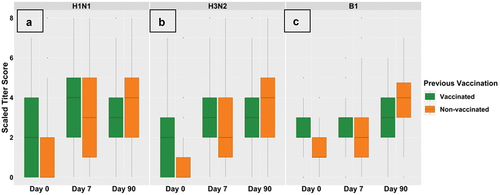
Table 4. Immunogenicity at Day 7 and Day 90 for the study participants. Statistical tests are used to inspect the differences between the vaccinated and non-vaccinated groups.
Figure 3. Overall response scores at day 7 (sub-figures a and B) and day 90 (sub-figures C and D) in vaccinated and non-vaccinated groups, respectively. Each participant’s score is represented by two points aligned vertically, a black point representing the participant’s score prior to vaccination (day 0) and a coloured point representing the corresponding score post-vaccination (day 7 or day 90). The colours are mapped according to the participant’s seroprotection level. Prior to vaccination, the average baseline scores were higher in the vaccinated group (black points in sub-figure a versus B and black points in sub-figure C versus D). Post- vaccination, the majority of participants in both groups showed an increase in their response scores as coloured points were vertically aligned over black points. Figures a and C show that vaccinated group participants with higher baseline scores seemed to have robust responses, while figures B and D show that non-vaccinated group participants seemed to have a uniform increase in response scores independent of baseline scores.
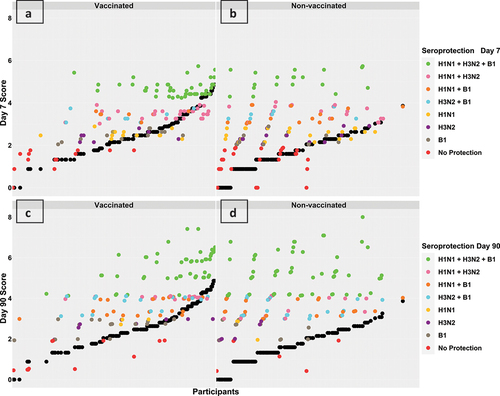
Figure 4. Repeated measurements of the vaccine response scores in vaccinated and non-vaccinated groups, respectively. The distributions at day 0 showed a clearly higher average score in the vaccinated group which remained slightly higher at day 7. The score distributions at day 90 seemed to be very similar in both groups with equal means.
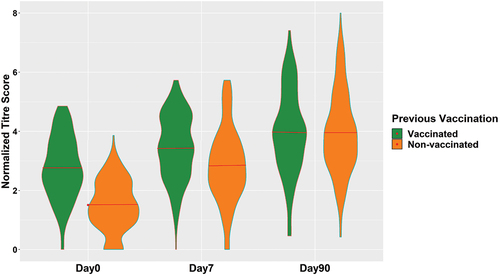
Table 5. Summary of mixed effect model parameters.
Table 6. Summary of post-vaccination seroprotection at Day 90 for a subset of non seroprotected participants at Day 0 then achieved seroprotection post-vaccination at Day 7. The Chi-squared test examines the differences between the number of seroprotected participants between the vaccinated and non-vaccinated groups.
Table 7. Summary of post-vaccination seroprotection at Day 90 for a subset of participants non seroprotected prior vaccination at Day 0 and not achieving serprotection post-vaccination at Day 7. The Chi-squared test examines the differences between the number of seroprotected participants between the vaccinated and non-vaccinated groups.
Supplemental Material
Download Zip (774.6 KB)Data availability statement
The datasets that support the findings of this study are managed by Kyoto University Graduate School and Faculty of Medicine and can be requested from the authors.