
Figures & data
Table 1. Epidemiological, effectiveness, and (dis)utility inputs in the population recommended for vaccination by SHC.
Table 2. Cost inputs in the population recommended for vaccination by the SHC, from all health-care payers’ perspective (NIHDI + patient).
Table 3. Clinical and economic outcomes in the adult population recommended for pneumococcal vaccination by the SHC, lifetime horizon (NIHDI + patient perspective).
Table 4. Clinical and economic outcomes in the 65–84 year olds with moderate risk, lifetime horizon (NIHDI perspective).
Table 5. Clinical and economic outcomes in the immunocompromised adults, the 50–64 year olds with underlying conditions and the healthy 65–84 year olds, lifetime horizon (patient perspective).
Figure 1. Tornado around the ICER in the adults recommended for vaccination by the SHC (NIHDI + patient perspective).
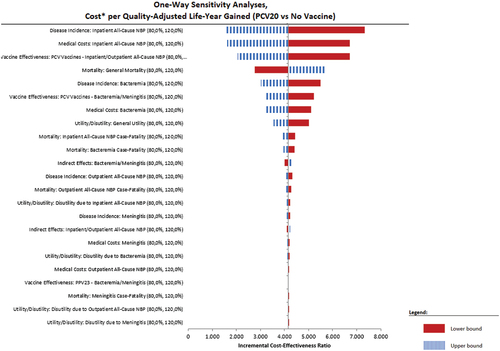
Figure 2. Tornado around the ICER in the adults recommended for vaccination but not reimbursed (patient perspective).
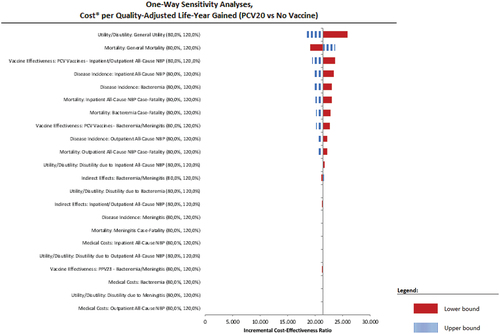
Figure 3. Cost-effectiveness plane – All adults recommended by the SHC (NIHDI + patient perspective), PCV20 vs. no vaccination. X-axis represents difference in QALYs and y-axis represents the difference in costs; red line represents willingness to pay (€35,000).
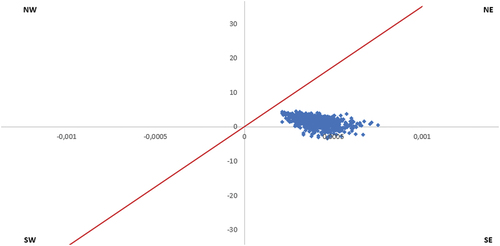
Figure 4. Cost-effectiveness plane – Adults recommended for vaccination and reimbursed (NIHDI perspective), PCV20 vs no vaccination. X-axis represents difference in QALYs; y-axis represents difference in costs; red line represents willingness to pay (€35,000).
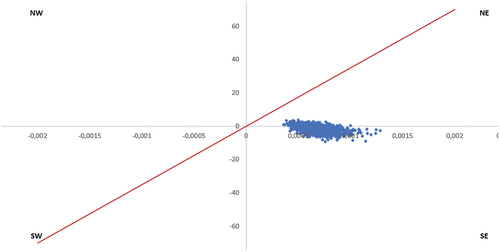
Figure 5. Cost-effectiveness plane – Adults recommended for vaccination but who have to fully finance access to vaccine (patient perspective), PCV20 vs. no vaccination. X-axis represents difference in QALYs; y-axis represents difference in costs; red line represents the willingness to pay (€35,000).
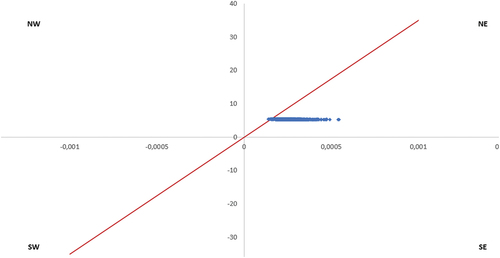
Figure 6. Cost-effectiveness plane – All adults recommended by the SHC (NIHDI + patient perspective), PCV20 vs. PCV15+PPV23. X-axis represents the difference in QALYs; y-axis represents difference in costs; red line represents willingness to pay (€35,000).
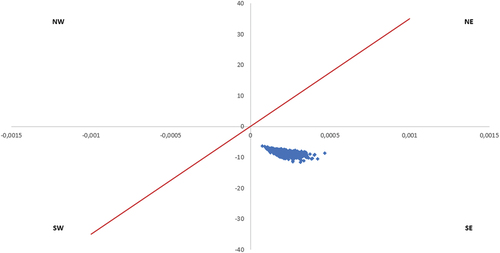
Table 6. Scenario analysis.