
Figures & data
Figure 1. Schematic depiction of the modeling method.
Cp, protective antibody concentration; PCV7, 7-valent pneumococcal conjugate vaccine; PCV13, 13-valent pneumococcal conjugate vaccine; PCV20, 20-valent pneumococcal conjugate vaccine; RCDC, reverse cumulative distribution curve; V114, 15-valent pneumococcal conjugate vaccine; VE, vaccine effectiveness.
The flow chart illustrates the two-step method for predicting the VE of the serotypes that V114 and PCV20 have in common with PCV7 or PCV13. Beginning with the known serotype-specific IgG concentrations after vaccination with PCV7/PCV13 (both placebo and active vaccine), simulated RCDCs are used, along with the known serotype-specific VE of PCV7 and PCV13 (nonPCV7 serotypes) (where VE ≈ 1- (pv/pc)), to derive the Cp for each serotype (red arrow in the left panel). Then, based on the known serotype-specific IgG concentrations in recipients of V114 (or PCV20), RCDCs are simulated for the same serotypes, and the previously derived Cp values are used to determine the VE (again in terms of pv and pc) for those serotypes in V114 (or PCV20; see arrows in right panel). As described in Siber et al [Citation18], pv is the percentage of subjects with antibody levels less than Cp in the vaccinated cohort, and pc is the percentage of subjects with antibody levels less than Cp in the control cohort.
Adapted from Ryman et al. 2022 [Citation17] which is licensed under a Creative Commons Attribution 4.0 International License (http://creativecommons.org/licenses/by/4.0/).
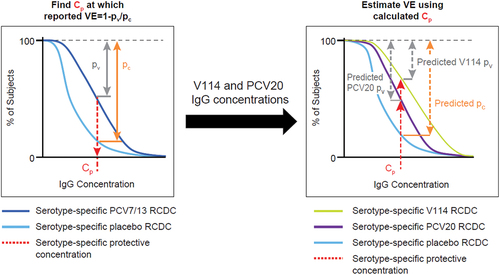
Table 1. Summary-level input data and sources.
Table 2. Estimated protective antibody concentrations.
Table 3. Observed and predicted vaccine effectiveness.
Figure 2. Absolute difference in predicted vaccine effectiveness for V114 and PCV20.
PCV7, 7-valent pneumococcal conjugate vaccine; PCV13, 13-valent pneumococcal conjugate vaccine; PCV20, 20-valent pneumococcal conjugate vaccine; V114, 15-valent pneumococcal conjugate vaccine.
Values reflect the predicted VE (%) for PCV20 subtracted from the predicted VE for V114%), summarized as median (point) and empirical 95% confidence interval (whiskers) across 5,000 simulations. Values greater than zero favor V114.
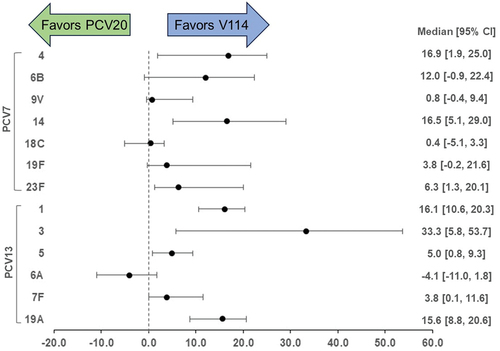
Table 4. Predicted effectiveness for serotype 3 using Andrews et al. (2014) PCV13 effectiveness estimates as input.
Supplemental material
Supplemental Material
Download (15.6 KB)Data availability statement
The authors confirm that the data supporting the findings of this study are available within the article or its supplementary materials.