Figures & data
Figure 1. The geographic distribution of wastewater sampling sites for polio with respect to outbreak counties, non-outbreak counties and the NY state in general. Note that sampling sites are primarily in outbreak counties as well as the adjacent non-outbreak counties with high population density.
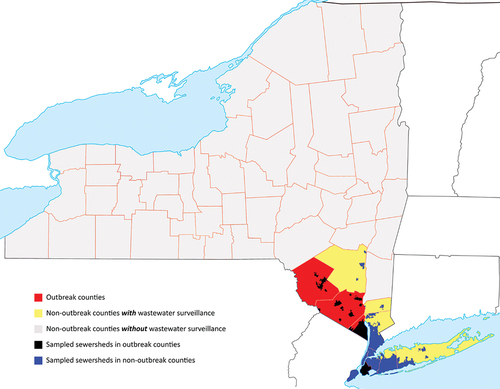
Table 1. New York State Wastewater characteristics for polio by outbreak and non-outbreak counties.
Table 2. Assignment of the percentage of New York State poliovirus WS observations for each mixing scenario for the.
Figure 2. Confidence about no circulation in NYS as a function of the detected-event free period assuming perfect acute flaccid myelitis (AFM) surveillance only (no WS). Dashed horizontal lines indicate 99% and 95% confidence levels for ease of reference. Note that with AFM alone, reaching high confidence of no circulation (95%) it will take approximately 4 years for the no isolation and partial isolation mixing scenarios, and never occurs for the subpopulation isolation mixing scenario for the model time horizon.
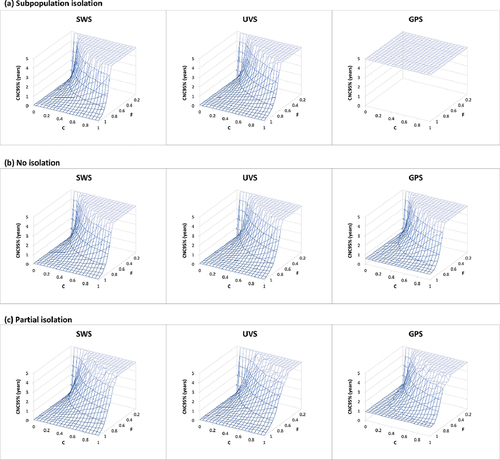
Figure 3. Detected-event-free period in years at which the confidence about no circulation exceeds 95% (CNC95%, z-axis) as a function of the wastewater surveillance (WS) sensitivity coefficient (C) assuming no AFM surveillance and perfect AFM surveillance. Results for different mixing assumptions are presented in panels a to c. For each set of results, SWS assumes distribution of WS sites equally over the general and under-vaccinated subpopulations, UVS assumes all WS sites represent only the under-vaccinated subpopulations, and GPS assumes all WS sites represent only the general subpopulations.
Figure 4. Surface plots of the detected-event-free period in years at which the confidence about no circulation exceeds 95% (CNC95%, z-axis) as a function of the fraction population (F) covered by wastewater surveillance (WS) and WS sensitivity coefficient level (C) assuming no AFM surveillance (same as figure 3 but zoomed in on the high quality WS range, i.e. high F and low C). Results for different mixing assumptions are presented in panels a to c. DEFP results are color-coded to highlight different scales of the z-axis. For each set of results, SWS assumes distribution of WS sites equally over the general and under-vaccinated subpopulations, UVS assumes all WS sites represent only the under-vaccinated subpopulations, and GPS assumes all WS sites represent only the general subpopulations.