
Figures & data
Figure 1. PRISMA flow diagram.
Table 1. Study characteristics.
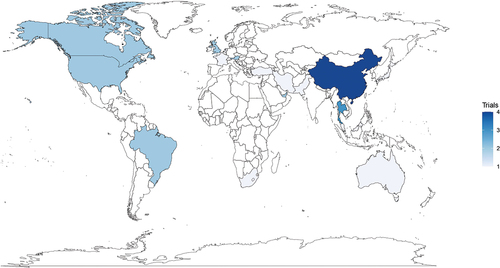
Figure 2. Map of countries with included studies.
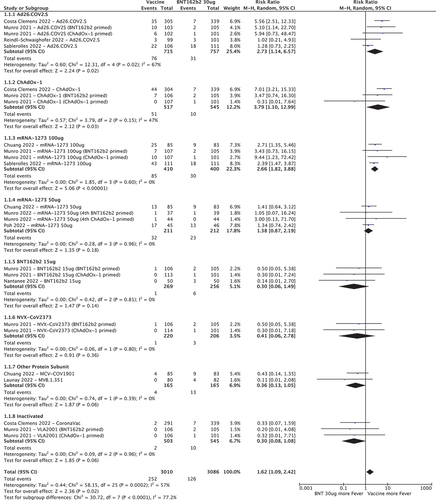
Forest plot 1. Risk ratios for fever – BNT162b2 30ug control.
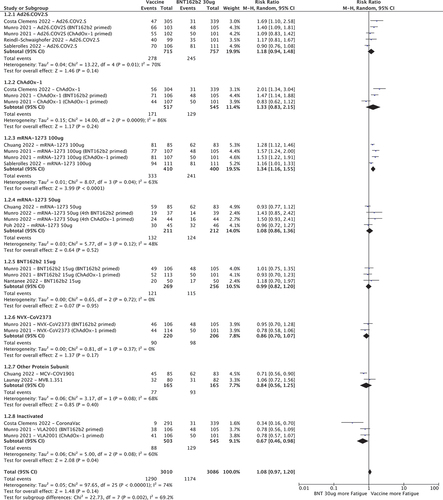
Forest plot 2. Risk ratios for fatigue – BNT162b2 30ug control.
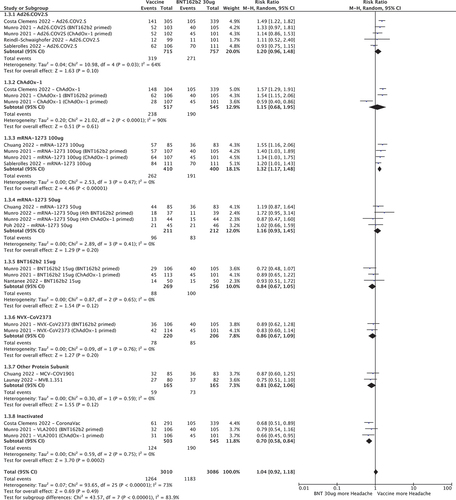
Forest plot 3. Risk ratios for headache – BNT162b2 30ug control.
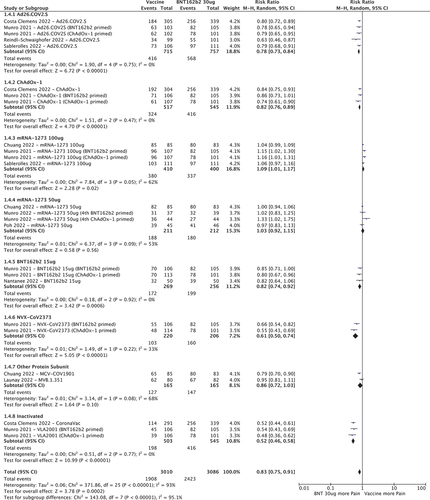
Forest plot 4. Risk ratios for injection site pain – BNT162b2 30ug control.
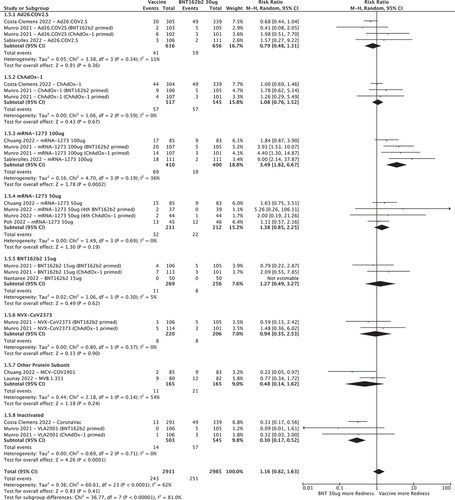
Forest plot 5. Risk ratios for redness – BNT162b2 30ug control.
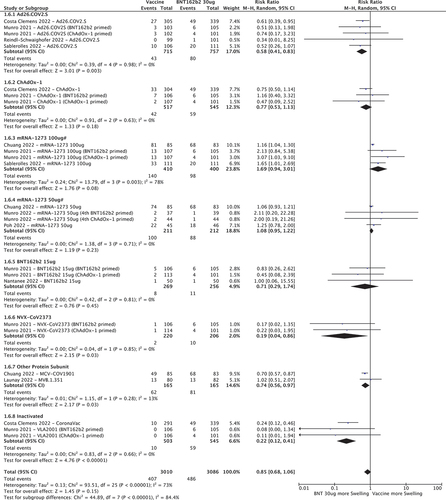
Forest plot 6. Risk ratios for swelling – BNT162b2 30ug control.#Redness grading criteria for Chuang 2022 were based on impact during daily activities while the other trials used milimeter measurements.
Supplemental material
Supplemental Material
Download Zip (4.6 MB)Data availability statement
Study data is available via reasonable requests directed to the corresponding author.