
Figures & data
Table 1. Characteristics of the cases (N = 1633) and controls (N = 4857); Italy, 2018/2019 to 2022/2023.
Figure 1. Projected weekly decline in influenza vaccine effectiveness in the total cohort (N = 6490) and probability of influenza among vaccinated individuals only (N = 1571), by virus (sub)type; Italy, 2018/2019 to 2022/2023.
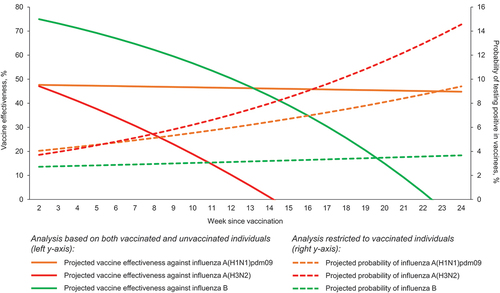
Table 2. Association between the time since vaccination and positivity to influenza virus, by virus (sub)type; Italy, 2018/2019 to 2022/2023.
Table 3. Association between the time since vaccination and positivity to influenza virus, by age-group and virus (sub)type; Italy, 2018/2019 to 2022/2023.
Table 4. Association between the time since vaccination and positivity to influenza virus: a sensitivity analysis based on the matching procedure to reduce the confounding due to calendar time.