
Figures & data
Figure 1. Study flow diagram. from 20 July 2022 to January 2023, a total of 100 eligible participants (age ≥18) out of 149 volunteers screened had been enrolled, who randomly assigned to receive 3 doses totally with LYB001 30 μg (n = 40), or LYB001 60 μg (n = 40) or vaccine ZF2001 (n = 20) at 1:1 in age subgroups (aged 18 ~ 59 years, ≥60 years). Blood samples were collected at day 14 after each vaccination, day 28 after the third dose vaccination to evaluate the post-vaccination immunogenicity. Serological samples were measured by neutralization test, ELISA and ELISPOT essay. Those were collected and assessed on the day of Day 0 (baseline), Day42 (at day 14 after the second dose vaccination), Day 70/Day 84 (the 14th day and the 28th day after the third dose vaccination) based on humoral immunity, cellular immunity and anti-VLP platform. During the second dose vaccination, 1 participant in group of vaccine LYB001 30 μg lost in follow-up visits; during the third dose vaccination, 1 in group of vaccine LYB001 60 μg, and 2 in control group were lost in follow-up visits.
Table 1. Demographic characteristics and baseline of all participants in the phase 1 trial.
Table 2. The solicited adverse events (AEs)* and adverse reactions (ARs)* from the first dose to the 28th day after three dose vaccination, and unsolicited adverse events based on NMPA guidelines by age and dose subgroups.
Figure 2. LYB001 induced significantly 50% live-virus and pseoduvirus-neutralizing antibody responses, compared with control group of vaccine ZF2001 by dose and age subgroups. a – d, Serum samples were collected at baseline (before prime vaccination), day 42 (at day 14 after the second dose vaccination), and day 70 and 84 (at day 14 and 28 after whole vaccination) in the LYB001 groups of 30 μg and 60 μg, and control group by the younger cohort and elderly cohort. a-b, A panel of real-virus immune responses of 50% SARS-CoV-2-neutralizing antibody GMTs measured by ELISA assay are demonstrated. c-d, A panel of pseoduvirus immune responses of 50% SARS-CoV-2-neutralizing antibody GMTs measured by ELISA assay are shown. Each point represents a serum sample, and each bar represents the mean of GMT with 95% CI by using Clopper-Pearson method. The dashed line indicates the lower limit of quantification (LLOQ). The LLOQ was 1:10 for the virus-neutralizing antibody test and 1:100 for ELISA. Neutralizing antibody responses of participants in each dose group of LYB001 were compared to the control group using analysis of covariance with log transformation. GMT as geometric mean titers; nAb as neutralizing antibody; TCID50 as 50% tissue culture infective Dose; WT as wild type strain of SARS-CoV-2; BA.4/5 as BA.4 or BA.5 of omicron strain of SARS-CoV-2; YOA as year of age; D0 as the baseline; 14d as 14 days; 28d as 28 days.
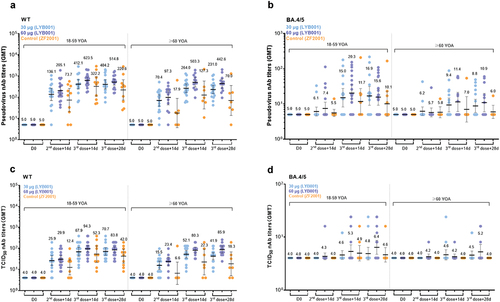
Figure 3. LYB001 induced strong S protein-binding antibody responses, compared with control group of vaccine ZF2001 by dose and age subgroups. serum samples were collected at baseline (before prime vaccination), day 42 (at day 14 after the second dose vaccination), and day 70 and 84 (at day 14 and 28 after whole vaccination) in the LYB001 groups of 30 μg and 60 μg, and control group by the younger cohort and elderly cohort. GMTs measured by ELISA assay are demonstrated. Each point represents a serum sample, and each bar represents the mean of GMT with 95% CI by using Clopper–Pearson method. The dashed line indicates the lower limit of quantification (LLOQ). The LLOQ was 1:10 for the virus-neutralizing antibody test and 1:100 for ELISA. S protein binding antibody titers of participants in each dose group of LYB001 were compared to the control group using analysis of covariance with log transformation.
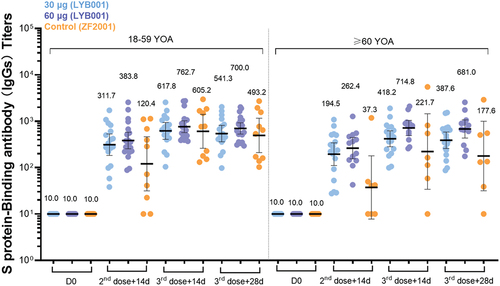
Figure 4. BLYB001 induced strong T cell responses in vaccinated participants compared with control group. blood specimen obtained on day 0 (baseline pre-vaccination), 42 (at day 14 in 2-dose post-vaccination) and 70 (at day 14 in whole vaccination) were stimulated overnight with overlapping peptide pools representing different portions of the wild-type sequence of SARS-CoV-2 for assessment in direct ex vivo IFN-γ ELISpot assay. Each dot represents the mean spot count from triplicate wells for one participant, after subtraction of the medium-only control by age subgroups. a-c, SARS-CoV-2 specific T cell response of IFN-γ (A), IL-2 (b), and IL-4(C) in younger (aged 18–59 years) and elderly (aged ≥60 years) participants are shown. Comparison of each cytokines between dose groups of LYB001 and control group were tested by using Kruskal-Wallis rank sum test based on geometric mean spot with 95% CIs.
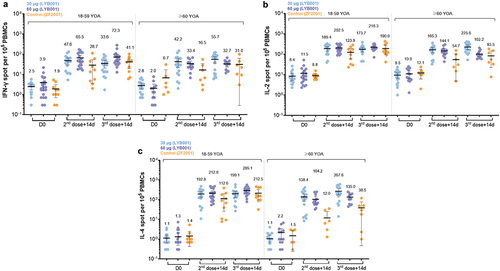
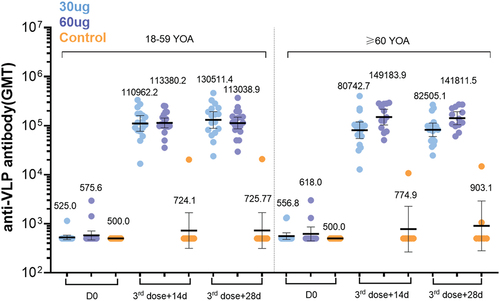
Figure 5. LYB001 elicited strong anti-VLP immune responses, compared with control group of vaccine ZF2001 by dose and age subgroups. serum samples were collected at baseline (before prime vaccination), day 70 (at day 14 after whole vaccination), and day 84 (at day 28 after whole vaccination) in the LYB001 groups of 30 μg and 60 μg, and control group by the younger cohort and elderly cohort. GMTs measured by ELISA assay are demonstrated. Each point represents a serum sample, and each bar represents the mean of GMT with 95% CI by using Clopper-Pearson method. Dose groups of LYB001 were compared to the control group using analysis of variance and ANOVA SNK for pairwise comparison of post hoc test.
Supplemental Material
Download MS Word (62.9 KB)Data availability statement
Due to the dataset in this study is not open to the public, appropriate access to the dataset can be requested and addressed to the corresponding authors Fengcai Zhu at [email protected], or Jing Jin at [email protected]. There is no current URL for direct access to the dataset, but reasonable requests or collaboration can be made.