
Figures & data
Figure 1. Design flow chart.
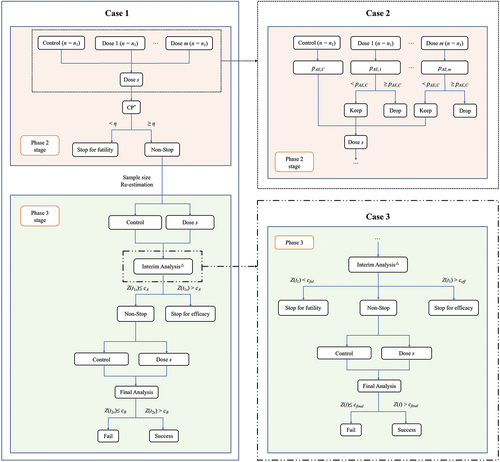
Figure 2. Performance of seamless design compared to conventional design for case 1 in terms of (a) Overall power, (b) Average sample size and (c) Trial duration when the null hypothesis is false.
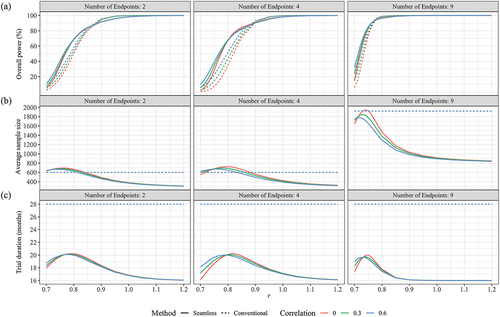
Figure 3. Performance of seamless design for Case 1 in terms of (a) Early stop percentages, (b) Correct dose selection when the null hypothesis is false.
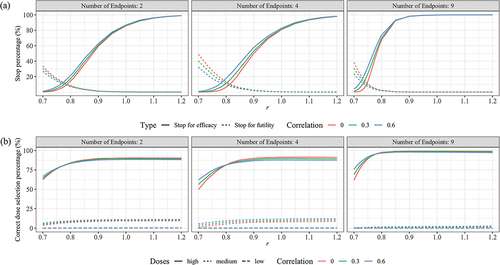
Figure 4. Performance of seamless design compared to conventional design for Case 2 in terms of (a) Overall power, (b) Average sample size and (c) trial duration when the null hypothesis is false.
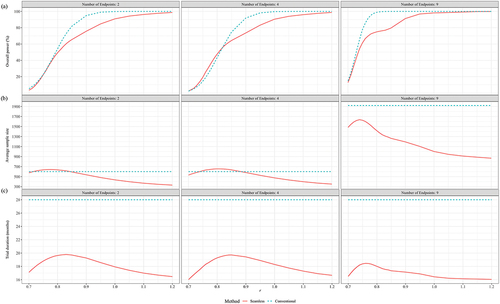
Figure 5. Performance of seamless design for Case 2 in terms of (a) Early stop percentages, (b) Correct dose selection when the null hypothesis is false.
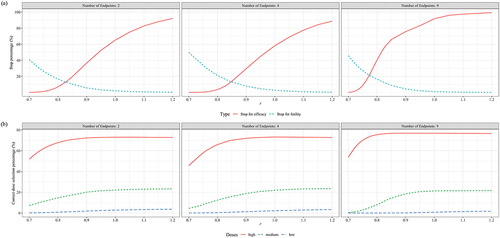
Figure 6. Performance of seamless design compared to conventional design for case 3 in terms of (a) Overall power, (b) Average sample size, (c) Trial duration and (d) Early stop percentages when the null hypothesis is false.
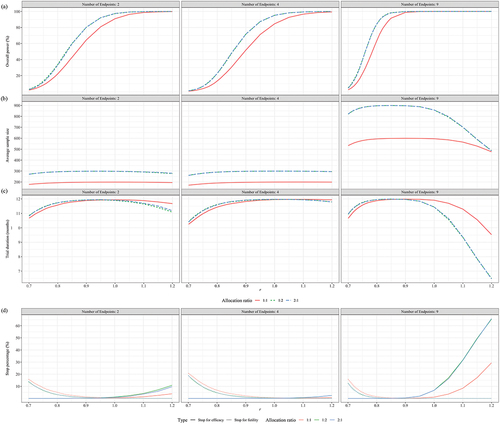
Table 1. Performance of seamless and conventional designs for Case 1 when the null hypothesis is true.
Table 2. Performance of seamless and conventional designs for Case 2 when the null hypothesis is true.
Table 3. Performance of two-stage and conventional designs for Case 3 when the null hypothesis is true.