Figures & data
Table I. Demographic and clinical characteristics of the study groups (N = 144)
Figure 1. Maternal plasma concentration of soluble endoglin (log(1 + s-Eng)) in normal pregnancies. The solid line represents the mean plasma concentration of s-Eng and the dotted line the 95% confidence interval.
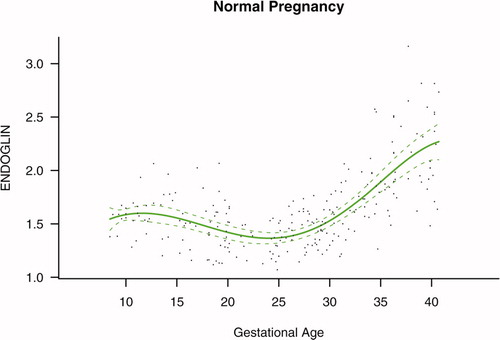
Figure 2. Maternal plasma concentration of placental growth factor (log(1 + PlGF)) in normal pregnancies. The solid line represents the mean plasma concentration of PlGF and the dotted line the 95% confidence interval.
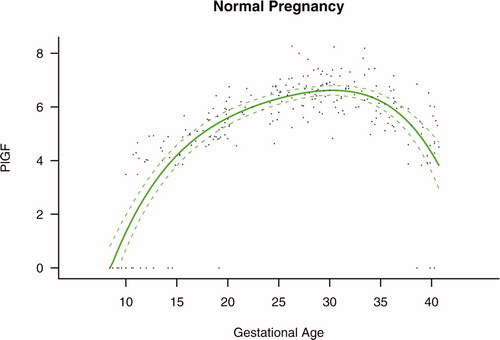
Figure 3. Maternal plasma concentration of soluble vascular endothelial growth factor receptor-1 (log(1 + sVEGFR-1)) in normal pregnancies. The solid line represents the mean plasma concentration of sVEGFR-1 and the dotted line the 95% confidence interval.
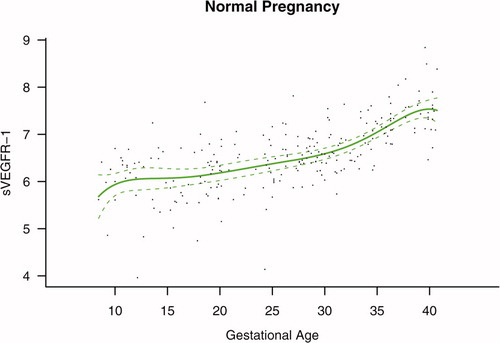
Figure 4. Forward analysis of the maternal plasma concentration of soluble endoglin (s-Eng) in patients with normal pregnancies and those with pregnancy complications. Patients who delivered an SGA neonate had a significantly higher plasma concentration of s-Eng from 10 weeks of gestation onwards than controls (p < 0.0001). The increment in plasma s-Eng in patients destined to develop preterm PE surpassed that of patients with normal pregnancies at 13 weeks and became significant at 23 weeks. In patients destined to develop PE at term, the maternal plasma concentration of s-Eng became significantly higher that that of normal patients at 30 weeks.
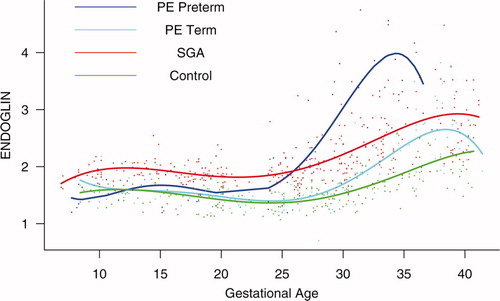
Figure 5. Backward analysis of the maternal plasma concentration of soluble endoglin (s-Eng) in patients with normal pregnancies and those with pregnancy complications. Patients destined to deliver an SGA neonate had a significantly higher plasma s-Eng concentration than controls up to 30 weeks before delivery.
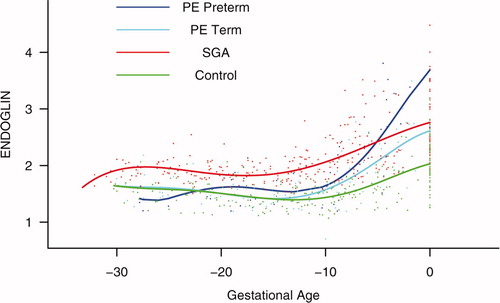
Figure 6. Forward analysis of the maternal plasma concentration of placental growth factor (PlGF) in patients with normal pregnancies and those with pregnancy complications. Patients destined to develop PE (term or preterm) and those who delivered an SGA neonate had a lower plasma concentration of PlGF throughout gestation than controls. These differences were statistically significant at 10 weeks of gestation for SGA and term PE and at 11 weeks for preterm PE.
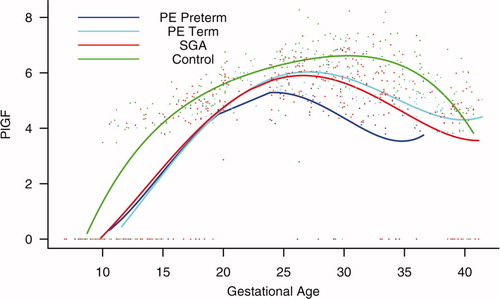
Table II. Maternal plasma placental growth factor (PlGF) elevation time
Table III. Maternal plasma placental growth factor/soluble endoglin (PlGF/s-Eng) ratio elevation time
Figure 7. Backward analysis of the maternal plasma concentration of placental growth factor (PlGF) in patients with normal pregnancies and those with pregnancy complications. Backward analysis indicated that patients destined to develop preterm PE, term PE, and those destined to deliver an SGA neonate had a significantly lower plasma PlGF concentration at 20, 12, and 16 weeks, respectively, before the clinical presentation of the disease when compared to controls.
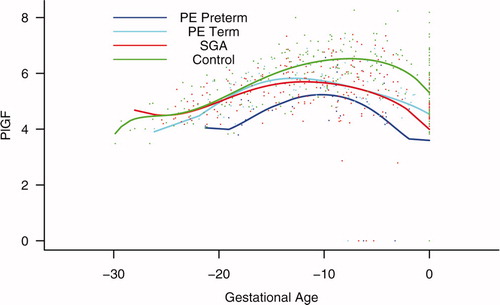
Figure 8. Forward analysis of the maternal plasma concentration of soluble vascular endothelial growth factor receptor-1 (sVEGFR-1) in patients with normal pregnancies and those with pregnancy complications. Patients destined to develop preterm and term PE had a significantly higher plasma concentration of sVEGFR-1 at 26 and 29 weeks of gestation, respectively, than controls. However, there was no difference in the increment of sVEGFR-1 between control patients and those who delivered an SGA neonate.
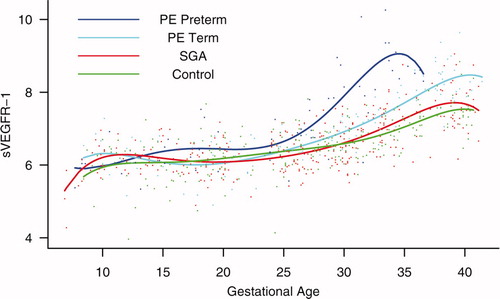
Figure 9. Backward analysis of the maternal plasma concentration of sVEGFR-1 in patients with normal pregnancies and those with pregnancy complications. Patients who developed preterm and term PE had a significantly higher plasma sVEGFR-1 concentration at 7 and 11 weeks, respectively, before the clinical diagnosis of the disease.
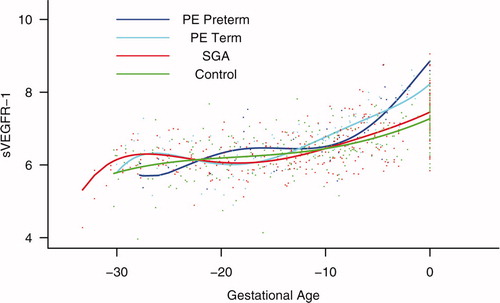
Figure 10. Mean and 95% confidence interval of the maternal plasma concentration of each analyte (log(1 + analyte)) in patients who developed PE (term and preterm), as well as those who delivered an SGA neonate. The mean analyte concentration of the normal pregnancy group (solid green line) is added to each plot for comparison.
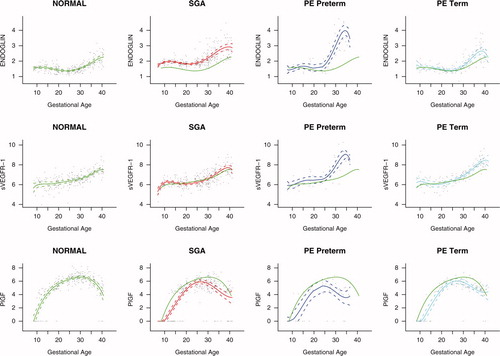
Table SI. Sensitivity (detection limit) and intra- and inter-assay coefficients of variation of the immunoassays for soluble endoglin, soluble vascular endothelial growth factor receptor-1, and placental growth factor.
Figure S1. Ratio of the maternal plasma concentration of placental growth factor and soluble endoglin (log(1 + PlGF/s-Eng)) in normal pregnancies. The solid line represents the mean ratio of PlGF/s-Eng and the dotted line the 95% confidence interval.
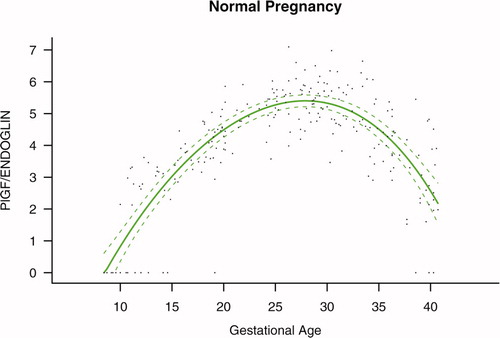
Figure S2. Ratio of the maternal plasma concentration of placental growth factor and soluble vascular endothelial growth factor receptor-1 (log(1 + PlGF/sVEGFR-1)) in normal pregnancies. The solid line represents the mean ratio of PlGF/s-VEGFR-1 and the dotted line the 95% confidence interval.
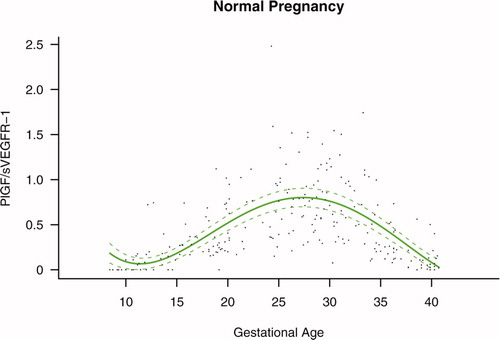
Figure S3. Forward analysis of the maternal plasma concentration of placental growth factor/soluble endoglin (PlGF/s-Eng) ratio in patients with normal pregnancies and those with pregnancy complications. Patients destined to develop preeclampsia (PE; term or preterm) and those who delivered a small for gestational age (SGA) neonate had lower plasma PlGF/s-Eng ratios throughout gestation than controls. These differences were statistically significant at 10 weeks of gestation.
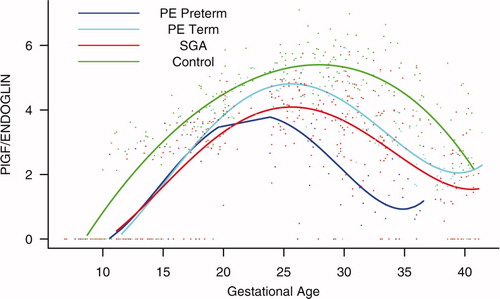
Figure S4. Backward analysis of the maternal plasma concentration of placental growth factor/soluble endoglin (PlGF/s-Eng) ratio in patients with normal pregnancies and those with pregnancy complications. Patients who developed preterm preeclampsia (PE) and those who delivered a small for gestational age (SGA) neonate had a significantly lower plasma PlGF/s-Eng ratio than those with normal pregnancies 20 weeks before the clinical diagnosis, and 10 weeks before the diagnosis of term PE.
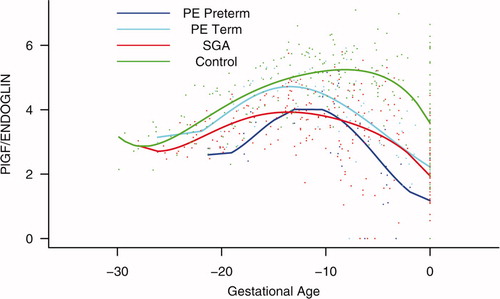
Figure S5. Forward analysis of the maternal plasma concentration of placental growth factor/soluble vascular endothelial growth factor receptor-1 (PlGF/s-VEGFR-1) ratio in patients with normal pregnancies and those with pregnancy complications. Patients destined to develop preterm preeclampsia (PE) and those who delivered a small for gestational age (SGA) neonate had lower plasma PlGF/sVEGFR-1 ratios from 15 weeks onwards than controls. These differences were statistically significant at 15 weeks of gestation for SGA and preterm PE, and at 21 weeks for term PE.
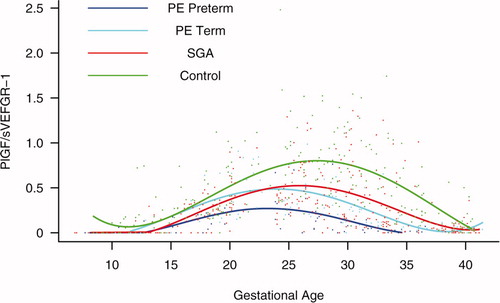
Figure S6. Backward analysis of the maternal plasma concentration of placental growth factor/soluble vascular endothelial growth factor receptor-1 (PlGF/s-VEGFR-1) ratio in patients with normal pregnancies and those with pregnancy complications. Patients who developed preterm and term preeclampsia (PE) had a significantly lower plasma PlGF/sVEGFR-1 ratio 20 and 14 weeks before the clinical diagnosis, respectively. Patients destined to deliver a small for gestational age (SGA) neonate had a significantly lower plasma PlGF/sVEGFR-1 ratio 15 weeks before delivery.
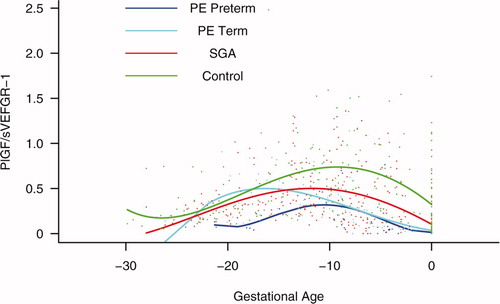
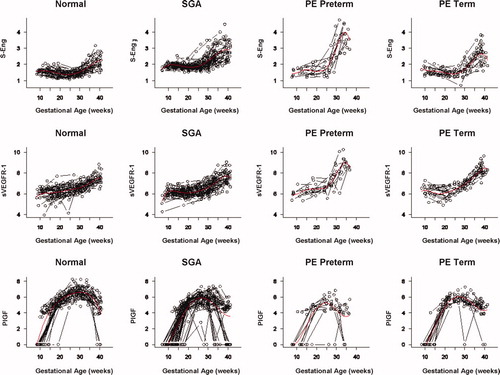
Figure S7. Individual changes in the maternal plasma concentration of soluble vascular endothelial growth factor receptor-1 (sVEGFR-1), placental growth factor (PlGF), and soluble endoglin (s-Eng) in normal patients and those destined to deliver a small for gestational age (SGA) neonate as well as in those destined to develop preterm preeclampsia (PE) and term PE. The dichotomous-looking PlGF values (zero versus non-zero) reflect the undetectable (0 value) concentration of PlGF in early gestation and the detectable concentration (>0) in mid and late gestation. For better model fitting, a piece-wise growth curve model for PlGF was used.