
Figures & data
Figure 1. The selection of the cohort introduced into analysis. The procedure for inclusion and exclusion of study subjects were shown in a flow chart.
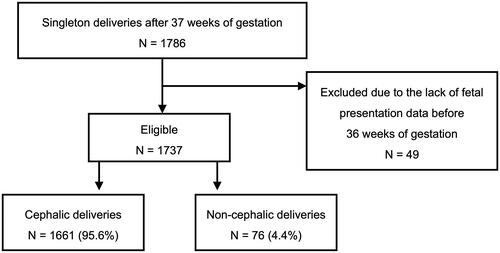
Table 1. Clinical characteristics.
Figure 2. Illustration of the definitions of the terms used in making of prediction model.
Focusing on the group showing non-cephalic presentation at 35/36 weeks of gestation (N = 89), we determined the optimal model for prediction of fetal presentation at delivery. In the statistical analysis (shown in Table 4), the terms of “positive” and “negative” were used, respectively, to mean the presence and the absence of cephalic observation at least once at and after a certain gestational week. The term, “true” was given to the two types of subsets, one in which cephalic delivery occurred after cephalic presentation observed at and after a certain gestational week and the other in which non-cephalic delivery occurred without cephalic observation during the same period. The term, “false” was used for the subsets that did not fit the conditions of true subsets.
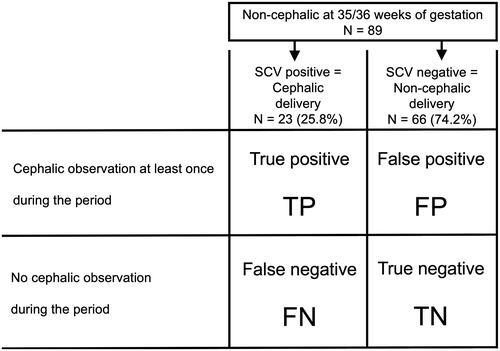
Figure 3. Sensitivity and specificity in the prediction models under different settings of data collection period.
The optimal model for prediction of non-cephalic delivery was explored focusing on the women in whom the fetus was non-cephalic at 35/36 WG. In the process, “cephalic observation at least once at and after a certain gestational week” was used a key parameter for prediction. The statistical analysis was conducted with different settings, in which the timing of gestational week to start collecting the data on fetal presentation was changed from 26 WG to 34 WG. Sensitivity and specificity in each setting is shown on the plot.
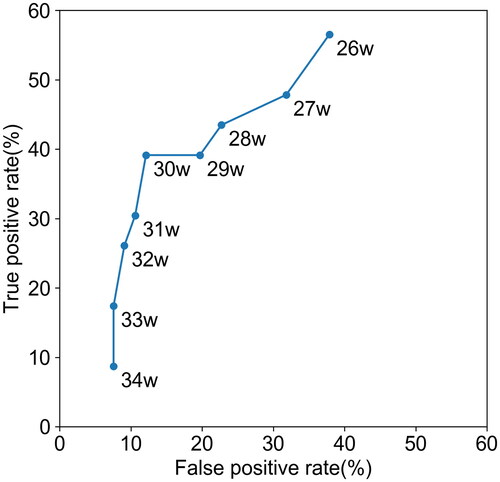
Table 2. Prediction models for final fetal presentation among women showing non-cephalic presentation at 35 or 36 WG.